Unknown entries from news log file:
First 6 / 6 lines (100.0%)
Log entries by program:
| Program name | Lines | %Lines | Size | %Size |
|---|---|---|---|---|
| inn | 242665 | 84.7% | 26.7 MB | 86.5% |
| innd | 26216 | 9.1% | 2.5 MB | 8.0% |
| nnrpd | 16506 | 5.8% | 1.6 MB | 5.0% |
| innfeed | 1234 | 0.4% | 161.6 KB | 0.5% |
| controlchan | 2 | 0.0% | 0.1 KB | 0.0% |
| overchan | 2 | 0.0% | 0.2 KB | 0.0% |
| TOTAL: 6 | 286625 | 100.0% | 30.8 MB | 100.0% |
History cache:
| Reason | Count | %Count |
|---|---|---|
| Do not exist | 483366 | 99.8% |
| Negative hits | 744 | 0.2% |
| Positive hits | 162 | 0.0% |
| Cache misses | 4 | 0.0% |
| TOTAL: 4 | 484276 | 100.0% |
INND timer:
| Code region | Time | Pct | Invoked | Min(ms) | Avg(ms) | Max(ms) |
|---|---|---|---|---|---|---|
| article cancel | 00:00:00.058 | 0.0% | 52 | 0.000 | 1.115 | 14.000 |
| article cleanup | 00:00:02.648 | 0.0% | 486106 | 0.001 | 0.005 | 0.012 |
| article logging | 00:00:10.126 | 0.0% | 486152 | 0.013 | 0.021 | 0.034 |
| article parse | 00:00:23.094 | 0.0% | 1440472 | 0.009 | 0.016 | 0.024 |
| article write | 00:02:04.342 | 0.1% | 486100 | 0.176 | 0.256 | 0.488 |
| artlog/artcncl | 00:00:00.000 | 0.0% | 20 | 0.000 | 0.000 | 0.000 |
| data move | 00:00:02.084 | 0.0% | 2092524 | 0.000 | 0.001 | 0.002 |
| hisgrep/artcncl | 00:00:00.016 | 0.0% | 72 | 0.000 | 0.222 | 1.000 |
| hishave/artcncl | 00:00:00.000 | 0.0% | 20 | 0.000 | 0.000 | 0.000 |
| history grep | 00:00:00.000 | 0.0% | 0 | 0.000 | 0.000 | 0.000 |
| history lookup | 00:00:39.270 | 0.0% | 486994 | 0.007 | 0.081 | 0.554 |
| history sync | 00:00:00.046 | 0.0% | 662 | 0.000 | 0.069 | 1.000 |
| history write | 00:00:56.374 | 0.0% | 486102 | 0.045 | 0.116 | 0.491 |
| idle | 47:46:45.640 | 99.5% | 1663796 | 47.001 | 103.381 | 251.892 |
| nntp read | 00:00:22.692 | 0.0% | 1330726 | 0.010 | 0.017 | 0.027 |
| overview write | 00:00:01.486 | 0.0% | 486100 | 0.000 | 0.003 | 0.009 |
| perl filter | 00:08:29.058 | 0.3% | 486102 | 0.663 | 1.047 | 1.460 |
| python filter | 00:00:00.148 | 0.0% | 486108 | 0.000 | 0.000 | 0.002 |
| site send | 00:00:11.710 | 0.0% | 983384 | 0.007 | 0.012 | 0.024 |
| TOTAL: 48:01:14.724 | 48:00:08.792 | 100.0% | - | - | - | - |
INNfeed timer:
| Code region | Time | Pct | Invoked | Min(ms) | Avg(ms) | Max(ms) |
|---|---|---|---|---|---|---|
| article new | 00:00:00.026 | 0.0% | 11144 | 0.000 | 0.002 | 0.050 |
| article prepare | 00:00:00.000 | 0.0% | 960 | 0.000 | 0.000 | 0.000 |
| article read | 00:00:00.006 | 0.0% | 240 | 0.000 | 0.025 | 0.500 |
| backlog stats | 00:00:00.020 | 0.0% | 67268 | 0.000 | 0.000 | 0.009 |
| callbacks | 00:00:00.000 | 0.0% | 0 | 0.000 | 0.000 | 0.000 |
| data read | 00:00:00.310 | 0.0% | 30962 | 0.000 | 0.010 | 0.093 |
| data write | 00:00:01.078 | 0.0% | 19784 | 0.000 | 0.054 | 0.132 |
| idle | 47:43:03.660 | 100.0% | 67268 | 1433.736 | 2553.720 | 6671.944 |
| status file | 00:00:00.108 | 0.0% | 320 | 0.000 | 0.338 | 1.000 |
| TOTAL: 47:43:05.952 | 47:43:05.208 | 100.0% | - | - | - | - |
nnrpd timer:
| Code region | Time | Pct | Invoked | Min(ms) | Avg(ms) | Max(ms) |
|---|---|---|---|---|---|---|
| idle | 00:01:44.714 | 70.9% | 8958 | 0.000 | 11.689 | 10050.000 |
| newnews | 00:00:00.000 | 0.0% | 0 | 0.000 | 0.000 | 0.000 |
| nntpwrite | 00:00:00.306 | 0.2% | 30100 | 0.000 | 0.010 | 0.667 |
| TOTAL: 00:02:27.728 | 00:01:45.020 | 71.1% | - | - | - | - |
Control commands to INND:
| Command | Number |
|---|---|
| flush | 54 |
| flushlogs | 4 |
| go | 4 |
| logmode | 4 |
| lowmark | 2 |
| mode | 298 |
| name | 4 |
| pause | 4 |
| paused | 4 |
| reload | 4 |
| reserve | 4 |
| TOTAL: 11 | 386 |
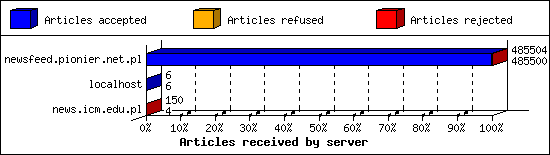
Incoming Feeds (INN):
| Server | Connects | Offered | Taken | Refused | Reject | %Accpt | Elapsed | |
|---|---|---|---|---|---|---|---|---|
| 1 | newsfeed.pionier.net.pl | 140 | 485504 | 485500 | 0 | 4 | 99% | 69:43:38 |
| 2 | localhost | 8 | 6 | 6 | 0 | 0 | 100% | 00:00:00 |
| 3 | news.icm.edu.pl | 66 | 150 | 4 | 144 | 2 | 2% | 16:18:06 |
| TOTAL: 3 | 214 | 485660 | 485510 | 144 | 6 | 99% | 86:01:44 | |
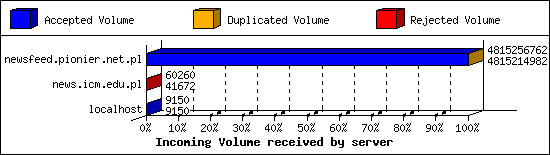
Incoming Volume (INN):
| Server | AcceptVol | DupVol | RejVol | TotalVol | %Acc | Vol/Art | |
|---|---|---|---|---|---|---|---|
| 1 | newsfeed.pionier.net.pl | 4.5 GB | 40.8 KB | 0.0 KB | 4.5 GB | 99% | 9.7 KB |
| 2 | news.icm.edu.pl | 40.7 KB | 0.0 KB | 18.2 KB | 58.8 KB | 69% | 9.8 KB |
| 3 | localhost | 8.9 KB | 0.0 KB | 0.0 KB | 8.9 KB | 100% | 1.5 KB |
| TOTAL: 3 | 4.5 GB | 40.8 KB | 18.2 KB | 4.5 GB | 99% | 9.7 KB | |
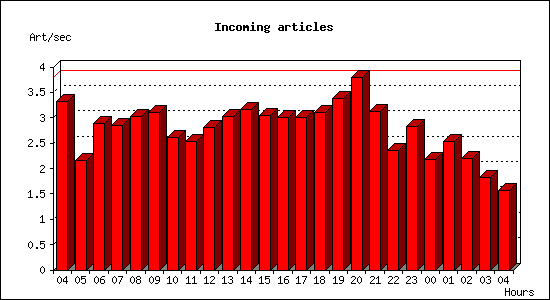
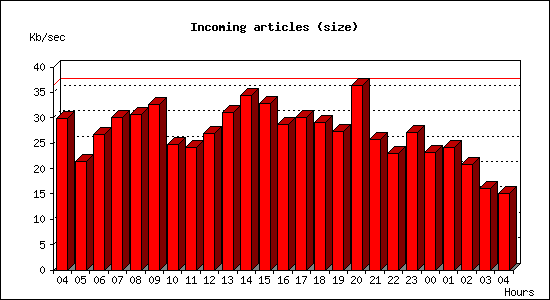
Incoming articles:
| Date | Articles | %Arts | Art/sec | Size | %Size | KB/sec |
|---|---|---|---|---|---|---|
| May 10 04:15:01 - 04:59:59 | 8987 | 3.7% | 3.33 | 78.5 MB | 3.4% | 29.77 |
| May 10 05:00:00 - 05:59:59 | 7742 | 3.2% | 2.15 | 75.1 MB | 3.3% | 21.37 |
| May 10 06:00:00 - 06:59:59 | 10414 | 4.3% | 2.89 | 94.1 MB | 4.1% | 26.78 |
| May 10 07:00:00 - 07:59:59 | 10249 | 4.2% | 2.85 | 105.9 MB | 4.6% | 30.13 |
| May 10 08:00:00 - 08:59:59 | 10876 | 4.5% | 3.02 | 108.0 MB | 4.7% | 30.71 |
| May 10 09:00:00 - 09:59:59 | 11137 | 4.6% | 3.09 | 114.5 MB | 5.0% | 32.58 |
| May 10 10:00:00 - 10:59:59 | 9382 | 3.9% | 2.61 | 86.9 MB | 3.8% | 24.71 |
| May 10 11:00:00 - 11:59:59 | 9088 | 3.7% | 2.52 | 85.0 MB | 3.7% | 24.18 |
| May 10 12:00:00 - 12:59:59 | 10115 | 4.2% | 2.81 | 94.3 MB | 4.1% | 26.83 |
| May 10 13:00:00 - 13:59:59 | 10924 | 4.5% | 3.03 | 109.0 MB | 4.7% | 31.00 |
| May 10 14:00:00 - 14:59:59 | 11419 | 4.7% | 3.17 | 120.9 MB | 5.3% | 34.38 |
| May 10 15:00:00 - 15:59:59 | 10958 | 4.5% | 3.04 | 115.3 MB | 5.0% | 32.79 |
| May 10 16:00:00 - 16:59:59 | 10850 | 4.5% | 3.01 | 100.7 MB | 4.4% | 28.64 |
| May 10 17:00:00 - 17:59:59 | 10823 | 4.5% | 3.01 | 105.9 MB | 4.6% | 30.12 |
| May 10 18:00:00 - 18:59:59 | 11138 | 4.6% | 3.09 | 102.3 MB | 4.5% | 29.08 |
| May 10 19:00:00 - 19:59:59 | 12143 | 5.0% | 3.37 | 95.9 MB | 4.2% | 27.29 |
| May 10 20:00:00 - 20:59:59 | 13642 | 5.6% | 3.79 | 128.0 MB | 5.6% | 36.40 |
| May 10 21:00:00 - 21:59:59 | 11215 | 4.6% | 3.12 | 90.3 MB | 3.9% | 25.69 |
| May 10 22:00:00 - 22:59:59 | 8459 | 3.5% | 2.35 | 80.5 MB | 3.5% | 22.89 |
| May 10 23:00:00 - 23:59:59 | 10197 | 4.2% | 2.83 | 94.9 MB | 4.1% | 27.00 |
| May 11 00:00:00 - 00:59:59 | 7848 | 3.2% | 2.18 | 81.3 MB | 3.5% | 23.12 |
| May 11 01:00:00 - 01:59:59 | 9090 | 3.7% | 2.52 | 84.9 MB | 3.7% | 24.15 |
| May 11 02:00:00 - 02:59:59 | 7941 | 3.3% | 2.21 | 73.1 MB | 3.2% | 20.80 |
| May 11 03:00:00 - 03:59:59 | 6578 | 2.7% | 1.83 | 56.8 MB | 2.5% | 16.16 |
| May 11 04:00:00 - 04:15:01 | 1414 | 0.6% | 1.57 | 13.3 MB | 0.6% | 15.09 |
| TOTAL: 24:00:00 | 242629 | 100.0% | 2.81 | 2.2 GB | 100.0% | 27.20 |
Sites sending bad articles:
| Server | Total | Group | Dist | Duplic | Unapp | TooOld | Site | Line | Other | |
|---|---|---|---|---|---|---|---|---|---|---|
| 1 | newsfeed.pionier.net.pl | 25 | 0 | 0 | 2 | 0 | 0 | 0 | 0 | 23 |
| 2 | news.icm.edu.pl | 1 | 0 | 0 | 0 | 0 | 0 | 0 | 0 | 1 |
| TOTAL: 2 | 26 | 0 | 0 | 2 | 0 | 0 | 0 | 0 | 24 | |
INND Perl filter [Top 20]:
| Reason | Count |
|---|---|
| Binary in non-binary group | 2 |
| TOTAL: 1 | 2 |
Miscellaneous innd statistics [Top 10]:
| Event | Server | Number |
|---|---|---|
| Including strange strings | ||
| newsfeed.pionier.net.pl | 23 | |
| TOTAL: 1 | 23 | |
| TOTAL: 1 | 23 | |
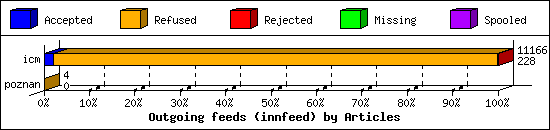
Outgoing Feeds (innfeed) by Articles:
| Server | Offered | Taken | Refused | Reject | Miss | Spool | %Took | Elapsed | |
|---|---|---|---|---|---|---|---|---|---|
| 1 | icm | 19796 | 228 | 10926 | 12 | 0 | 0 | 1% | 47:59:56 |
| 2 | poznan | 4 | 0 | 4 | 0 | 0 | 0 | 0% | 01:00:02 |
| TOTAL: 2 | 19800 | 228 | 10930 | 12 | 0 | 0 | 1% | 48:59:58 | |
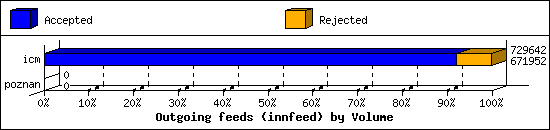
Outgoing Feeds (innfeed) by Volume:
| Server | AcceptVol | RejectVol | TotalVol | Volume/sec | Vol/Art | Elapsed | |
|---|---|---|---|---|---|---|---|
| 1 | icm | 656.2 KB | 56.3 KB | 712.5 KB | 0.0 KB/s | 3.0 KB | 47:59:56 |
| 2 | poznan | 0.0 KB | 0.0 KB | 0.0 KB | 0.0 KB/s | 0 | 01:00:02 |
| TOTAL: 2 | 656.2 KB | 56.3 KB | 712.5 KB | 0.0 KB/s | 3.0 KB | 48:59:58 | |
NNRP readership statistics:
| System | Conn | Arts | Size | Groups | Post | Rej | Elapsed | |
|---|---|---|---|---|---|---|---|---|
| 1 | 165.154.182.207 | 6 | 0 | 0.0 KB | 0 | 0 | 0 | 00:00:23 |
| 2 | 147.185.132.111 | 2 | 0 | 0.0 KB | 0 | 0 | 0 | 00:00:03 |
| 3 | nms1.man.lodz.pl | 2880 | 0 | 0.0 KB | 0 | 0 | 0 | 00:00:31 |
| 4 | 80.111.142.213 | 8 | 0 | 0.0 KB | 0 | 0 | 0 | 00:00:05 |
| 5 | 147.185.132.174 | 2 | 0 | 0.0 KB | 0 | 0 | 0 | 00:00:03 |
| 6 | 212.51.192.185 | 192 | 0 | 0.0 KB | 0 | 0 | 0 | 00:00:02 |
| 7 | heightened.monitoring.internet-measurement.com | 2 | 0 | 0.0 KB | 0 | 0 | 0 | 00:00:03 |
| 8 | 20.65.194.47 | 2 | 0 | 0.0 KB | 0 | 0 | 0 | 00:00:19 |
| 9 | 167.94.145.100 | 6 | 0 | 0.0 KB | 0 | 0 | 0 | 00:00:07 |
| 10 | 172.16.2.4 | 576 | 0 | 0.0 KB | 0 | 0 | 0 | 00:00:34 |
| 11 | isvcs01.man.lodz.pl | 6 | 0 | 0.0 KB | 0 | 6 | 0 | 00:00:00 |
| 12 | 162.142.125.124 | 2 | 0 | 0.0 KB | 0 | 0 | 0 | 00:00:11 |
| TOTAL: 12 | 3684 | 0 | 0.0 KB | 0 | 6 | 0 | 00:02:28 | |
NNRP readership statistics (by domain):
| System | Conn | Arts | Size | Groups | Post | Rej | Elapsed | |
|---|---|---|---|---|---|---|---|---|
| 1 | unresolved | 796 | 0 | 0.0 KB | 0 | 0 | 0 | 00:01:52 |
| 2 | *.monitoring.internet-measurement.com | 2 | 0 | 0.0 KB | 0 | 0 | 0 | 00:00:03 |
| 3 | *.man.lodz.pl | 2886 | 0 | 0.0 KB | 0 | 6 | 0 | 00:00:32 |
| TOTAL: 3 | 3684 | 0 | 0.0 KB | 0 | 6 | 0 | 00:02:28 | |
NNRP total resource statistics [Top 20]:
| System | User(ms) | System(ms) | Idle(ms) | Elapsed |
|---|---|---|---|---|
| 172.16.2.4 | 2.360 | 4.438 | 0.000 | 00:00:34 |
| nms1.man.lodz.pl | 10.620 | 20.032 | 0.000 | 00:00:31 |
| 165.154.182.207 | 0.028 | 0.048 | 0.000 | 00:00:23 |
| 20.65.194.47 | 0.010 | 0.018 | 0.000 | 00:00:19 |
| 162.142.125.124 | 0.080 | 0.024 | 0.000 | 00:00:11 |
| 167.94.145.100 | 0.114 | 0.054 | 0.000 | 00:00:07 |
| 80.111.142.213 | 0.042 | 0.074 | 0.000 | 00:00:05 |
| heightened.monitoring.internet-measurement.com | 0.008 | 0.022 | 0.000 | 00:00:03 |
| 147.185.132.111 | 0.008 | 0.008 | 0.000 | 00:00:03 |
| 147.185.132.174 | 0.008 | 0.008 | 0.000 | 00:00:03 |
| 212.51.192.185 | 0.810 | 1.372 | 0.000 | 00:00:02 |
| isvcs01.man.lodz.pl | 0.032 | 0.056 | 0.000 | 00:00:00 |
| TOTAL: 12 | 14.120 | 26.154 | 0.000 | 00:02:28 |
NNRP unrecognized commands (by host) [Top 20]:
| System | Conn |
|---|---|
| 165.154.182.207 | 4 |
| 167.94.145.100 | 2 |
| 162.142.125.124 | 2 |
| TOTAL: 3 | 8 |
NNRP unrecognized commands (by command) [Top 20]:
| Command | Count |
|---|---|
| EHLO www.censys.io | 4 |
| À#024 | 2 |
| #026#003#001#001#027#001 | 2 |
| TOTAL: 3 | 8 |
NNRP client timeouts [Top 20]:
| System | Conn | Peer |
|---|---|---|
| 167.94.145.100 | 2 | 4 |
| TOTAL: 1 | 2 | 8 |