
Unknown entries from news log file:
First 4 / 4 lines (100.0%)
Log entries by program:
| Program name | Lines | %Lines | Size | %Size |
|---|---|---|---|---|
| inn | 246449 | 86.2% | 27.5 MB | 87.7% |
| innd | 22420 | 7.8% | 2.2 MB | 7.0% |
| nnrpd | 15940 | 5.6% | 1.5 MB | 4.8% |
| innfeed | 1214 | 0.4% | 158.2 KB | 0.5% |
| controlchan | 2 | 0.0% | 0.1 KB | 0.0% |
| TOTAL: 5 | 286025 | 100.0% | 31.3 MB | 100.0% |
History cache:
| Reason | Count | %Count |
|---|---|---|
| Do not exist | 485124 | 89.0% |
| Cache misses | 30706 | 5.6% |
| Negative hits | 29380 | 5.4% |
| Positive hits | 106 | 0.0% |
| TOTAL: 4 | 545316 | 100.0% |
INND timer:
| Code region | Time | Pct | Invoked | Min(ms) | Avg(ms) | Max(ms) |
|---|---|---|---|---|---|---|
| article cancel | 00:00:02.100 | 0.0% | 130 | 0.000 | 16.154 | 28.000 |
| article cleanup | 00:00:03.126 | 0.0% | 492830 | 0.002 | 0.006 | 0.013 |
| article logging | 00:00:11.864 | 0.0% | 492846 | 0.012 | 0.024 | 0.038 |
| article parse | 00:00:36.442 | 0.0% | 1703126 | 0.015 | 0.021 | 0.032 |
| article write | 00:09:35.466 | 0.3% | 488114 | 0.511 | 1.179 | 3.713 |
| artlog/artcncl | 00:00:00.002 | 0.0% | 56 | 0.000 | 0.036 | 0.053 |
| data move | 00:00:02.814 | 0.0% | 2570862 | 0.000 | 0.001 | 0.003 |
| hisgrep/artcncl | 00:00:01.204 | 0.0% | 186 | 0.000 | 6.473 | 23.000 |
| hishave/artcncl | 00:00:00.000 | 0.0% | 56 | 0.000 | 0.000 | 0.000 |
| history grep | 00:00:00.000 | 0.0% | 0 | 0.000 | 0.000 | 0.000 |
| history lookup | 00:15:19.918 | 0.5% | 549448 | 0.009 | 1.674 | 9.129 |
| history sync | 00:00:00.036 | 0.0% | 666 | 0.000 | 0.054 | 1.000 |
| history write | 00:19:04.608 | 0.7% | 488116 | 0.077 | 2.345 | 9.486 |
| idle | 47:01:05.478 | 97.9% | 1934582 | 28.334 | 87.495 | 221.366 |
| nntp read | 00:00:30.558 | 0.0% | 1620216 | 0.008 | 0.019 | 0.029 |
| overview write | 00:00:01.866 | 0.0% | 488114 | 0.000 | 0.004 | 0.011 |
| perl filter | 00:13:12.266 | 0.5% | 488116 | 1.187 | 1.623 | 2.119 |
| python filter | 00:00:00.164 | 0.0% | 488120 | 0.000 | 0.000 | 0.009 |
| site send | 00:00:13.776 | 0.0% | 988876 | 0.010 | 0.014 | 0.020 |
| TOTAL: 48:01:24.540 | 48:00:01.688 | 100.0% | - | - | - | - |
INNfeed timer:
| Code region | Time | Pct | Invoked | Min(ms) | Avg(ms) | Max(ms) |
|---|---|---|---|---|---|---|
| article new | 00:00:00.026 | 0.0% | 12606 | 0.000 | 0.002 | 0.033 |
| article prepare | 00:00:00.000 | 0.0% | 384 | 0.000 | 0.000 | 0.000 |
| article read | 00:00:00.002 | 0.0% | 96 | 0.000 | 0.021 | 1.000 |
| backlog stats | 00:00:00.024 | 0.0% | 69412 | 0.000 | 0.000 | 0.008 |
| callbacks | 00:00:00.000 | 0.0% | 0 | 0.000 | 0.000 | 0.000 |
| data read | 00:00:00.406 | 0.0% | 33112 | 0.000 | 0.012 | 0.065 |
| data write | 00:00:01.276 | 0.0% | 20438 | 0.000 | 0.062 | 0.160 |
| idle | 47:43:06.982 | 100.0% | 69412 | 1455.264 | 2474.889 | 8703.667 |
| status file | 00:00:00.138 | 0.0% | 314 | 0.000 | 0.439 | 2.000 |
| TOTAL: 47:43:09.738 | 47:43:08.854 | 100.0% | - | - | - | - |
nnrpd timer:
| Code region | Time | Pct | Invoked | Min(ms) | Avg(ms) | Max(ms) |
|---|---|---|---|---|---|---|
| idle | 00:18:27.306 | 95.5% | 12072 | 0.000 | 91.725 | 3414.000 |
| newnews | 00:00:00.000 | 0.0% | 0 | 0.000 | 0.000 | 0.000 |
| nntpwrite | 00:00:00.610 | 0.1% | 43102 | 0.000 | 0.014 | 0.500 |
| readart | 00:00:07.026 | 0.6% | 3188 | 1.385 | 2.204 | 2.785 |
| TOTAL: 00:19:19.266 | 00:18:34.942 | 96.2% | - | - | - | - |
Control commands to INND:
| Command | Number |
|---|---|
| flush | 54 |
| flushlogs | 4 |
| go | 4 |
| logmode | 4 |
| lowmark | 2 |
| mode | 298 |
| name | 4 |
| pause | 4 |
| paused | 4 |
| reload | 4 |
| reserve | 4 |
| TOTAL: 11 | 386 |
Incoming Feeds (INN):
| Server | Connects | Offered | Taken | Refused | Reject | %Accpt | Elapsed | |
|---|---|---|---|---|---|---|---|---|
| 1 | newsfeed.pionier.net.pl | 170 | 518930 | 488236 | 26020 | 4674 | 94% | 74:07:02 |
| 2 | localhost | 6 | 4 | 4 | 0 | 0 | 100% | 00:00:00 |
| 3 | news.icm.edu.pl | 56 | 96 | 2 | 92 | 2 | 2% | 11:41:20 |
| TOTAL: 3 | 232 | 519030 | 488242 | 26112 | 4676 | 94% | 85:48:22 | |
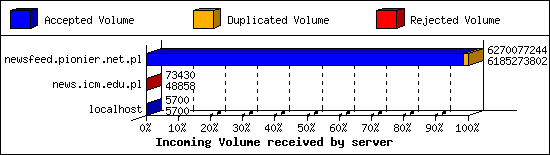
Incoming Volume (INN):
| Server | AcceptVol | DupVol | RejVol | TotalVol | %Acc | Vol/Art | |
|---|---|---|---|---|---|---|---|
| 1 | newsfeed.pionier.net.pl | 5.8 GB | 80.9 MB | 0.0 KB | 5.8 GB | 98% | 12.4 KB |
| 2 | news.icm.edu.pl | 47.7 KB | 0.0 KB | 24.0 KB | 71.7 KB | 66% | 17.9 KB |
| 3 | localhost | 5.6 KB | 0.0 KB | 0.0 KB | 5.6 KB | 100% | 1.4 KB |
| TOTAL: 3 | 5.8 GB | 80.9 MB | 24.0 KB | 5.8 GB | 98% | 12.4 KB | |
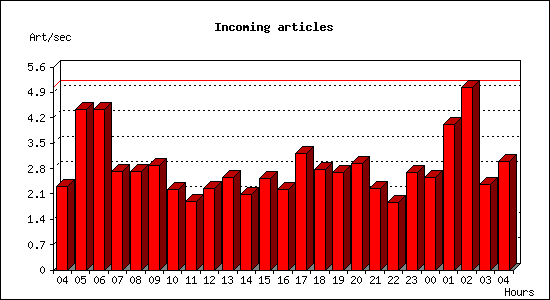
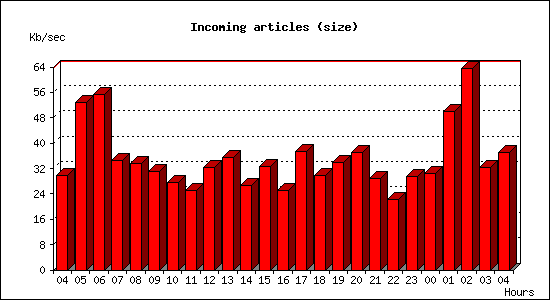
Incoming articles:
| Date | Articles | %Arts | Art/sec | Size | %Size | KB/sec |
|---|---|---|---|---|---|---|
| Jul 11 04:15:01 - 04:59:59 | 6214 | 2.5% | 2.30 | 78.3 MB | 2.7% | 29.71 |
| Jul 11 05:00:00 - 05:59:59 | 15958 | 6.5% | 4.43 | 185.9 MB | 6.3% | 52.88 |
| Jul 11 06:00:00 - 06:59:59 | 15917 | 6.5% | 4.42 | 195.0 MB | 6.6% | 55.47 |
| Jul 11 07:00:00 - 07:59:59 | 9745 | 4.0% | 2.71 | 121.0 MB | 4.1% | 34.42 |
| Jul 11 08:00:00 - 08:59:59 | 9766 | 4.0% | 2.71 | 118.0 MB | 4.0% | 33.57 |
| Jul 11 09:00:00 - 09:59:59 | 10377 | 4.3% | 2.88 | 108.7 MB | 3.7% | 30.93 |
| Jul 11 10:00:00 - 10:59:59 | 7998 | 3.3% | 2.22 | 97.3 MB | 3.3% | 27.68 |
| Jul 11 11:00:00 - 11:59:59 | 6769 | 2.8% | 1.88 | 87.8 MB | 3.0% | 24.97 |
| Jul 11 12:00:00 - 12:59:59 | 8060 | 3.3% | 2.24 | 113.7 MB | 3.9% | 32.33 |
| Jul 11 13:00:00 - 13:59:59 | 9225 | 3.8% | 2.56 | 125.2 MB | 4.2% | 35.61 |
| Jul 11 14:00:00 - 14:59:59 | 7500 | 3.1% | 2.08 | 94.0 MB | 3.2% | 26.75 |
| Jul 11 15:00:00 - 15:59:59 | 9111 | 3.7% | 2.53 | 114.8 MB | 3.9% | 32.64 |
| Jul 11 16:00:00 - 16:59:59 | 8020 | 3.3% | 2.23 | 88.0 MB | 3.0% | 25.04 |
| Jul 11 17:00:00 - 17:59:59 | 11610 | 4.8% | 3.23 | 131.1 MB | 4.4% | 37.28 |
| Jul 11 18:00:00 - 18:59:59 | 10008 | 4.1% | 2.78 | 105.1 MB | 3.6% | 29.89 |
| Jul 11 19:00:00 - 19:59:59 | 9724 | 4.0% | 2.70 | 119.4 MB | 4.1% | 33.97 |
| Jul 11 20:00:00 - 20:59:59 | 10528 | 4.3% | 2.92 | 130.3 MB | 4.4% | 37.07 |
| Jul 11 21:00:00 - 21:59:59 | 8106 | 3.3% | 2.25 | 101.2 MB | 3.4% | 28.78 |
| Jul 11 22:00:00 - 22:59:59 | 6752 | 2.8% | 1.88 | 77.7 MB | 2.6% | 22.10 |
| Jul 11 23:00:00 - 23:59:59 | 9642 | 4.0% | 2.68 | 103.9 MB | 3.5% | 29.57 |
| Jul 12 00:00:00 - 00:59:59 | 9233 | 3.8% | 2.56 | 106.7 MB | 3.6% | 30.36 |
| Jul 12 01:00:00 - 01:59:59 | 14491 | 5.9% | 4.03 | 176.2 MB | 6.0% | 50.13 |
| Jul 12 02:00:00 - 02:59:59 | 18105 | 7.4% | 5.03 | 223.1 MB | 7.6% | 63.45 |
| Jul 12 03:00:00 - 03:59:59 | 8512 | 3.5% | 2.36 | 113.6 MB | 3.9% | 32.31 |
| Jul 12 04:00:00 - 04:15:01 | 2705 | 1.1% | 3.00 | 32.7 MB | 1.1% | 37.14 |
| TOTAL: 24:00:00 | 244076 | 100.0% | 2.82 | 2.9 GB | 100.0% | 34.95 |
Sites sending bad articles:
| Server | Total | Group | Dist | Duplic | Unapp | TooOld | Site | Line | Other | |
|---|---|---|---|---|---|---|---|---|---|---|
| 1 | newsfeed.pionier.net.pl | 2344 | 0 | 0 | 2336 | 0 | 0 | 0 | 0 | 8 |
| 2 | news.icm.edu.pl | 1 | 0 | 0 | 0 | 0 | 0 | 0 | 0 | 1 |
| TOTAL: 2 | 2345 | 0 | 0 | 2336 | 0 | 0 | 0 | 0 | 9 | |
INND Perl filter [Top 20]:
| Reason | Count |
|---|---|
| Binary in non-binary group | 2 |
| TOTAL: 1 | 2 |
Miscellaneous innd statistics [Top 10]:
| Event | Server | Number |
|---|---|---|
| Including strange strings | ||
| newsfeed.pionier.net.pl | 8 | |
| TOTAL: 1 | 8 | |
| TOTAL: 1 | 8 | |
Outgoing Feeds (innfeed) by Articles:
| Server | Offered | Taken | Refused | Reject | Miss | Spool | %Took | Elapsed | |
|---|---|---|---|---|---|---|---|---|---|
| 1 | icm | 20616 | 80 | 12532 | 16 | 0 | 0 | 0% | 47:59:56 |
| 2 | poznan | 2 | 0 | 2 | 0 | 0 | 0 | 0% | 00:40:00 |
| TOTAL: 2 | 20618 | 80 | 12534 | 16 | 0 | 0 | 0% | 48:39:56 | |

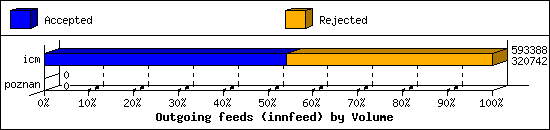
Outgoing Feeds (innfeed) by Volume:
| Server | AcceptVol | RejectVol | TotalVol | Volume/sec | Vol/Art | Elapsed | |
|---|---|---|---|---|---|---|---|
| 1 | icm | 313.2 KB | 266.3 KB | 579.5 KB | 0.0 KB/s | 6.0 KB | 47:59:56 |
| 2 | poznan | 0.0 KB | 0.0 KB | 0.0 KB | 0.0 KB/s | 0 | 00:40:00 |
| TOTAL: 2 | 313.2 KB | 266.3 KB | 579.5 KB | 0.0 KB/s | 6.0 KB | 48:39:56 | |
NNRP readership statistics:
| System | Conn | Arts | Size | Groups | Post | Rej | Elapsed | |
|---|---|---|---|---|---|---|---|---|
| 1 | syn-066-061-096-239.res.spectrum.com | 108 | 3188 | 3.4 MB | 16 | 0 | 0 | 00:17:12 |
| 2 | isvcs01.man.lodz.pl | 4 | 0 | 0.0 KB | 0 | 4 | 0 | 00:00:00 |
| TOTAL: 2 | 112 | 3188 | 3.4 MB | 16 | 4 | 0 | 00:19:19 | |
NNRP readership statistics (by domain):
| System | Conn | Arts | Size | Groups | Post | Rej | Elapsed | |
|---|---|---|---|---|---|---|---|---|
| 1 | *.res.spectrum.com | 108 | 3188 | 3.4 MB | 16 | 0 | 0 | 00:17:12 |
| 2 | *.man.lodz.pl | 2550 | 0 | 0.0 KB | 0 | 4 | 0 | 00:00:31 |
| 3 | unresolved | 802 | 0 | 0.0 KB | 0 | 0 | 0 | 00:01:30 |
| 4 | *.monitoring.internet-measurement.com | 2 | 0 | 0.0 KB | 0 | 0 | 0 | 00:00:03 |
| 5 | *.stretchoid.com | 2 | 0 | 0.0 KB | 0 | 0 | 0 | 00:00:00 |
| TOTAL: 5 | 3464 | 3188 | 3.4 MB | 16 | 4 | 0 | 00:19:19 | |
NNRP total resource statistics [Top 20]:
| System | User(ms) | System(ms) | Idle(ms) | Elapsed |
|---|---|---|---|---|
| syn-066-061-096-239.res.spectrum.com | 0.732 | 1.536 | 0.000 | 00:17:12 |
| 172.16.2.4 | 2.764 | 5.598 | 0.000 | 00:00:35 |
| nms1.man.lodz.pl | 12.116 | 23.250 | 0.000 | 00:00:31 |
| 167.94.138.172 | 0.030 | 0.072 | 0.000 | 00:00:21 |
| 167.94.138.189 | 0.136 | 0.070 | 0.000 | 00:00:14 |
| 167.94.146.62 | 0.092 | 0.044 | 0.000 | 00:00:07 |
| 80.111.142.213 | 0.056 | 0.074 | 0.000 | 00:00:04 |
| meritable.monitoring.internet-measurement.com | 0.006 | 0.026 | 0.000 | 00:00:03 |
| 212.51.192.185 | 0.866 | 1.762 | 0.000 | 00:00:02 |
| 205.210.31.90 | 0.010 | 0.016 | 0.000 | 00:00:02 |
| 198.235.24.216 | 0.008 | 0.010 | 0.000 | 00:00:01 |
| 71.6.134.230 | 0.006 | 0.026 | 0.000 | 00:00:00 |
| azpdcglpqdjn.stretchoid.com | 0.012 | 0.020 | 0.000 | 00:00:00 |
| isvcs01.man.lodz.pl | 0.032 | 0.040 | 0.000 | 00:00:00 |
| 147.185.132.204 | 0.008 | 0.026 | 0.000 | 00:00:00 |
| TOTAL: 15 | 16.874 | 32.570 | 0.000 | 00:19:19 |
Curious NNRP server explorers [Top 20]:
| System | Conn |
|---|---|
| nms1.man.lodz.pl | 2546 |
| 172.16.2.4 | 576 |
| 212.51.192.185 | 190 |
| 80.111.142.213 | 8 |
| 167.94.138.172 | 8 |
| 167.94.138.189 | 6 |
| 167.94.146.62 | 6 |
| 205.210.31.90 | 2 |
| 147.185.132.204 | 2 |
| 198.235.24.216 | 2 |
| azpdcglpqdjn.stretchoid.com | 2 |
| 71.6.134.230 | 2 |
| meritable.monitoring.internet-measurement.com | 2 |
| TOTAL: 13 | 3352 |
NNRP unrecognized commands (by host) [Top 20]:
| System | Conn |
|---|---|
| azpdcglpqdjn.stretchoid.com | 2 |
| 167.94.138.189 | 2 |
| 167.94.146.62 | 2 |
| TOTAL: 3 | 6 |
NNRP unrecognized commands (by command) [Top 20]:
| Command | Count |
|---|---|
| EHLO www.censys.io | 4 |
| MGLNDD_212.191.2.21_119 | 2 |
| TOTAL: 2 | 6 |
NNRP client timeouts [Top 20]:
| System | Conn | Peer |
|---|---|---|
| 167.94.138.172 | 2 | 8 |
| 167.94.138.189 | 2 | 4 |
| 167.94.146.62 | 2 | 4 |
| TOTAL: 3 | 6 | 22 |
Newsgroup request counts (by hierarchy):
| Hierarchy | Count | Pct | |
|---|---|---|---|
| 1 | lodman | 3188 | 100.0% |
| TOTAL: 1 | 3188 | 100.0% | |
Newsgroup request counts (by newsgroup) [Top 100]:
| Newsgroup | Count | |
|---|---|---|
| 1 | lodman.info | 3188 |
| TOTAL: 1 | 3188 | |