Unknown entries from news log file:
First 4 / 4 lines (100.0%)
Log entries by program:
| Program name | Lines | %Lines | Size | %Size |
|---|---|---|---|---|
| inn | 270851 | 84.4% | 29.7 MB | 86.3% |
| innd | 32942 | 10.3% | 3.1 MB | 9.0% |
| nnrpd | 15752 | 4.9% | 1.5 MB | 4.3% |
| innfeed | 1232 | 0.4% | 139.1 KB | 0.4% |
| overchan | 2 | 0.0% | 0.4 KB | 0.0% |
| controlchan | 2 | 0.0% | 0.1 KB | 0.0% |
| TOTAL: 6 | 320781 | 100.0% | 34.4 MB | 100.0% |
History cache:
| Reason | Count | %Count |
|---|---|---|
| Do not exist | 540680 | 99.9% |
| Negative hits | 578 | 0.1% |
| Positive hits | 58 | 0.0% |
| Cache misses | 2 | 0.0% |
| TOTAL: 4 | 541318 | 100.0% |
INND timer:
| Code region | Time | Pct | Invoked | Min(ms) | Avg(ms) | Max(ms) |
|---|---|---|---|---|---|---|
| article cancel | 00:00:00.006 | 0.0% | 62 | 0.000 | 0.097 | 2.000 |
| article cleanup | 00:00:01.298 | 0.0% | 541304 | 0.000 | 0.002 | 0.007 |
| article logging | 00:00:06.376 | 0.0% | 541420 | 0.004 | 0.012 | 0.020 |
| article parse | 00:00:10.384 | 0.0% | 2000980 | 0.003 | 0.005 | 0.008 |
| article write | 00:00:16.416 | 0.0% | 541304 | 0.017 | 0.030 | 0.049 |
| artlog/artcncl | 00:00:00.000 | 0.0% | 14 | 0.000 | 0.000 | 0.000 |
| data move | 00:00:01.366 | 0.0% | 2909748 | 0.000 | 0.000 | 0.002 |
| hisgrep/artcncl | 00:00:00.002 | 0.0% | 76 | 0.000 | 0.026 | 0.500 |
| hishave/artcncl | 00:00:00.000 | 0.0% | 14 | 0.000 | 0.000 | 0.000 |
| history grep | 00:00:00.000 | 0.0% | 0 | 0.000 | 0.000 | 0.000 |
| history lookup | 00:00:18.484 | 0.0% | 541928 | 0.000 | 0.034 | 0.243 |
| history sync | 00:00:00.022 | 0.0% | 612 | 0.000 | 0.036 | 0.500 |
| history write | 00:01:24.980 | 0.0% | 541304 | 0.026 | 0.157 | 0.384 |
| idle | 47:52:37.008 | 99.7% | 2361920 | 9.356 | 72.973 | 153.664 |
| nntp read | 00:00:15.004 | 0.0% | 1910752 | 0.005 | 0.008 | 0.013 |
| overview write | 00:00:00.744 | 0.0% | 541304 | 0.000 | 0.001 | 0.004 |
| perl filter | 00:04:34.114 | 0.2% | 541304 | 0.367 | 0.506 | 0.642 |
| python filter | 00:00:00.088 | 0.0% | 541308 | 0.000 | 0.000 | 0.002 |
| site send | 00:00:06.964 | 0.0% | 1094572 | 0.003 | 0.006 | 0.011 |
| TOTAL: 48:00:34.290 | 47:59:53.256 | 100.0% | - | - | - | - |
INNfeed timer:
| Code region | Time | Pct | Invoked | Min(ms) | Avg(ms) | Max(ms) |
|---|---|---|---|---|---|---|
| article new | 00:00:00.012 | 0.0% | 11942 | 0.000 | 0.001 | 0.048 |
| article prepare | 00:00:00.000 | 0.0% | 400 | 0.000 | 0.000 | 0.000 |
| article read | 00:00:00.000 | 0.0% | 100 | 0.000 | 0.000 | 0.000 |
| backlog stats | 00:00:00.012 | 0.0% | 75898 | 0.000 | 0.000 | 0.007 |
| callbacks | 00:00:00.000 | 0.0% | 0 | 0.000 | 0.000 | 0.000 |
| data read | 00:00:00.252 | 0.0% | 34714 | 0.000 | 0.007 | 0.044 |
| data write | 00:00:00.750 | 0.0% | 22668 | 0.000 | 0.033 | 0.115 |
| idle | 47:40:03.216 | 100.0% | 75898 | 997.456 | 2260.972 | 8012.520 |
| status file | 00:00:00.150 | 0.0% | 320 | 0.000 | 0.469 | 4.000 |
| TOTAL: 47:40:05.114 | 47:40:04.392 | 100.0% | - | - | - | - |
nnrpd timer:
| Code region | Time | Pct | Invoked | Min(ms) | Avg(ms) | Max(ms) |
|---|---|---|---|---|---|---|
| idle | 00:10:04.172 | 92.8% | 12780 | 1.000 | 47.275 | 10051.000 |
| newnews | 00:00:00.000 | 0.0% | 0 | 0.000 | 0.000 | 0.000 |
| nntpwrite | 00:00:00.320 | 0.0% | 37694 | 0.000 | 0.008 | 0.333 |
| TOTAL: 00:10:51.392 | 00:10:04.492 | 92.8% | - | - | - | - |
Control commands to INND:
| Command | Number |
|---|---|
| flush | 54 |
| flushlogs | 4 |
| go | 4 |
| logmode | 4 |
| lowmark | 2 |
| mode | 298 |
| name | 4 |
| pause | 4 |
| paused | 4 |
| reload | 4 |
| reserve | 4 |
| TOTAL: 11 | 386 |
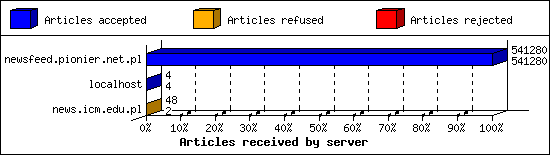
Incoming Feeds (INN):
| Server | Connects | Offered | Taken | Refused | Reject | %Accpt | Elapsed | |
|---|---|---|---|---|---|---|---|---|
| 1 | newsfeed.pionier.net.pl | 212 | 541280 | 541280 | 0 | 0 | 100% | 79:08:28 |
| 2 | localhost | 6 | 4 | 4 | 0 | 0 | 100% | 00:00:00 |
| 3 | news.icm.edu.pl | 34 | 48 | 2 | 46 | 0 | 4% | 06:29:28 |
| TOTAL: 3 | 252 | 541332 | 541286 | 46 | 0 | 99% | 85:37:56 | |
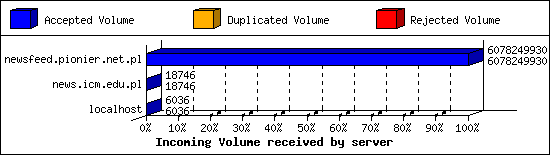
Incoming Volume (INN):
| Server | AcceptVol | DupVol | RejVol | TotalVol | %Acc | Vol/Art | |
|---|---|---|---|---|---|---|---|
| 1 | newsfeed.pionier.net.pl | 5.7 GB | 0.0 KB | 0.0 KB | 5.7 GB | 100% | 11.0 KB |
| 2 | news.icm.edu.pl | 18.3 KB | 0.0 KB | 0.0 KB | 18.3 KB | 100% | 9.2 KB |
| 3 | localhost | 5.9 KB | 0.0 KB | 0.0 KB | 5.9 KB | 100% | 1.5 KB |
| TOTAL: 3 | 5.7 GB | 0.0 KB | 0.0 KB | 5.7 GB | 100% | 11.0 KB | |
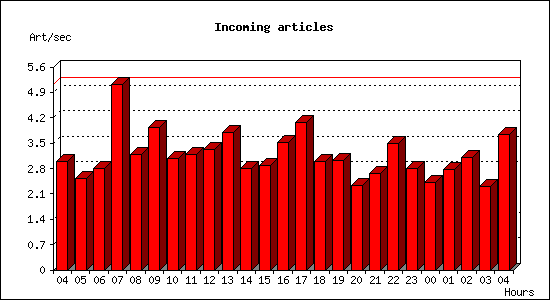
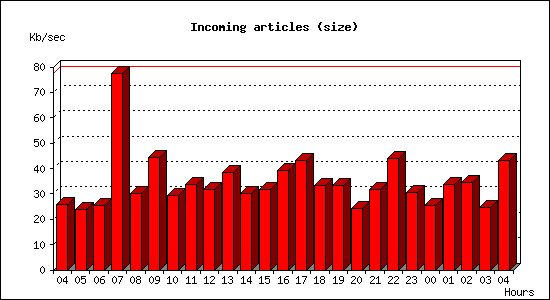
Incoming articles:
| Date | Articles | %Arts | Art/sec | Size | %Size | KB/sec |
|---|---|---|---|---|---|---|
| Jul 29 04:15:01 - 04:59:59 | 8086 | 3.0% | 3.00 | 68.4 MB | 2.4% | 25.95 |
| Jul 29 05:00:00 - 05:59:59 | 9072 | 3.4% | 2.52 | 83.5 MB | 2.9% | 23.75 |
| Jul 29 06:00:00 - 06:59:59 | 10050 | 3.7% | 2.79 | 89.2 MB | 3.1% | 25.38 |
| Jul 29 07:00:00 - 07:59:59 | 18407 | 6.8% | 5.11 | 271.9 MB | 9.4% | 77.33 |
| Jul 29 08:00:00 - 08:59:59 | 11480 | 4.2% | 3.19 | 106.6 MB | 3.7% | 30.31 |
| Jul 29 09:00:00 - 09:59:59 | 14178 | 5.2% | 3.94 | 156.0 MB | 5.4% | 44.36 |
| Jul 29 10:00:00 - 10:59:59 | 11071 | 4.1% | 3.08 | 103.7 MB | 3.6% | 29.49 |
| Jul 29 11:00:00 - 11:59:59 | 11519 | 4.3% | 3.20 | 119.1 MB | 4.1% | 33.87 |
| Jul 29 12:00:00 - 12:59:59 | 11983 | 4.4% | 3.33 | 111.9 MB | 3.9% | 31.83 |
| Jul 29 13:00:00 - 13:59:59 | 13629 | 5.0% | 3.79 | 135.2 MB | 4.7% | 38.46 |
| Jul 29 14:00:00 - 14:59:59 | 10099 | 3.7% | 2.81 | 106.2 MB | 3.7% | 30.21 |
| Jul 29 15:00:00 - 15:59:59 | 10380 | 3.8% | 2.88 | 111.9 MB | 3.9% | 31.82 |
| Jul 29 16:00:00 - 16:59:59 | 12668 | 4.7% | 3.52 | 138.1 MB | 4.8% | 39.29 |
| Jul 29 17:00:00 - 17:59:59 | 14644 | 5.4% | 4.07 | 151.2 MB | 5.2% | 43.01 |
| Jul 29 18:00:00 - 18:59:59 | 10742 | 4.0% | 2.98 | 117.3 MB | 4.0% | 33.36 |
| Jul 29 19:00:00 - 19:59:59 | 10876 | 4.0% | 3.02 | 116.9 MB | 4.0% | 33.26 |
| Jul 29 20:00:00 - 20:59:59 | 8370 | 3.1% | 2.33 | 85.6 MB | 3.0% | 24.36 |
| Jul 29 21:00:00 - 21:59:59 | 9549 | 3.5% | 2.65 | 112.2 MB | 3.9% | 31.90 |
| Jul 29 22:00:00 - 22:59:59 | 12514 | 4.6% | 3.48 | 154.9 MB | 5.3% | 44.05 |
| Jul 29 23:00:00 - 23:59:59 | 10033 | 3.7% | 2.79 | 106.7 MB | 3.7% | 30.35 |
| Jul 30 00:00:00 - 00:59:59 | 8645 | 3.2% | 2.40 | 89.2 MB | 3.1% | 25.38 |
| Jul 30 01:00:00 - 01:59:59 | 9936 | 3.7% | 2.76 | 118.5 MB | 4.1% | 33.70 |
| Jul 30 02:00:00 - 02:59:59 | 11212 | 4.1% | 3.11 | 121.4 MB | 4.2% | 34.53 |
| Jul 30 03:00:00 - 03:59:59 | 8272 | 3.1% | 2.30 | 86.4 MB | 3.0% | 24.58 |
| Jul 30 04:00:00 - 04:15:01 | 3371 | 1.2% | 3.74 | 38.0 MB | 1.3% | 43.24 |
| TOTAL: 24:00:00 | 270786 | 100.0% | 3.13 | 2.8 GB | 100.0% | 34.37 |
Sites sending bad articles:
| Server | Total | Group | Dist | Duplic | Unapp | TooOld | Site | Line | Other | |
|---|---|---|---|---|---|---|---|---|---|---|
| 1 | newsfeed.pionier.net.pl | 58 | 0 | 0 | 0 | 0 | 0 | 0 | 0 | 58 |
| TOTAL: 1 | 58 | 0 | 0 | 0 | 0 | 0 | 0 | 0 | 58 | |
Miscellaneous innd statistics [Top 10]:
| Event | Server | Number |
|---|---|---|
| Including strange strings | ||
| newsfeed.pionier.net.pl | 58 | |
| TOTAL: 1 | 58 | |
| TOTAL: 1 | 58 | |
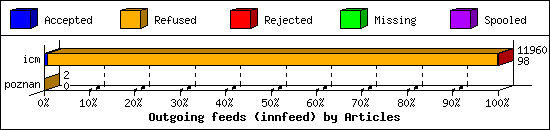
Outgoing Feeds (innfeed) by Articles:
| Server | Offered | Taken | Refused | Reject | Miss | Spool | %Took | Elapsed | |
|---|---|---|---|---|---|---|---|---|---|
| 1 | icm | 22776 | 98 | 11860 | 2 | 0 | 0 | 0% | 47:59:06 |
| 2 | poznan | 2 | 0 | 2 | 0 | 0 | 0 | 0% | 00:40:00 |
| TOTAL: 2 | 22778 | 98 | 11862 | 2 | 0 | 0 | 0% | 48:39:06 | |
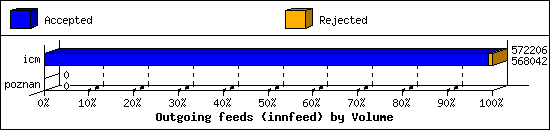
Outgoing Feeds (innfeed) by Volume:
| Server | AcceptVol | RejectVol | TotalVol | Volume/sec | Vol/Art | Elapsed | |
|---|---|---|---|---|---|---|---|
| 1 | icm | 554.7 KB | 4.1 KB | 558.8 KB | 0.0 KB/s | 5.6 KB | 47:59:06 |
| 2 | poznan | 0.0 KB | 0.0 KB | 0.0 KB | 0.0 KB/s | 0 | 00:40:00 |
| TOTAL: 2 | 554.7 KB | 4.1 KB | 558.8 KB | 0.0 KB/s | 5.6 KB | 48:39:06 | |
NNRP readership statistics:
| System | Conn | Arts | Size | Groups | Post | Rej | Elapsed | |
|---|---|---|---|---|---|---|---|---|
| 1 | 206.168.34.86 | 2 | 0 | 0.0 KB | 0 | 0 | 0 | 00:00:25 |
| 2 | syn-066-061-098-095.res.spectrum.com | 8 | 0 | 0.0 KB | 0 | 0 | 0 | 00:08:29 |
| 3 | 172.16.2.4 | 576 | 0 | 0.0 KB | 0 | 0 | 0 | 00:00:33 |
| 4 | 141.98.83.86 | 2 | 0 | 0.0 KB | 0 | 0 | 0 | 00:00:00 |
| 5 | 139.162.225.221.socradar-curiosity-wide-scan-project.socradar.com | 2 | 0 | 0.0 KB | 0 | 0 | 0 | 00:00:20 |
| 6 | 147.185.132.87 | 2 | 0 | 0.0 KB | 0 | 0 | 0 | 00:00:06 |
| 7 | 80.94.95.168 | 2 | 0 | 0.0 KB | 0 | 0 | 0 | 00:00:00 |
| 8 | azpdws28galu.stretchoid.com | 4 | 0 | 0.0 KB | 0 | 0 | 0 | 00:00:20 |
| 9 | isvcs01.man.lodz.pl | 4 | 0 | 0.0 KB | 0 | 4 | 0 | 00:00:00 |
| 10 | 198.235.24.232 | 2 | 0 | 0.0 KB | 0 | 0 | 0 | 00:00:05 |
| 11 | 80.111.142.213 | 8 | 0 | 0.0 KB | 0 | 0 | 0 | 00:00:06 |
| 12 | 45.146.130.122 | 2 | 0 | 0.0 KB | 0 | 0 | 0 | 00:00:00 |
| 13 | nms1.man.lodz.pl | 2880 | 0 | 0.0 KB | 0 | 0 | 0 | 00:00:25 |
| TOTAL: 13 | 3494 | 0 | 0.0 KB | 0 | 4 | 0 | 00:10:52 | |
NNRP readership statistics (by domain):
| System | Conn | Arts | Size | Groups | Post | Rej | Elapsed | |
|---|---|---|---|---|---|---|---|---|
| 1 | *.162.225.221.socradar-curiosity-wide-scan-project.socradar.com | 2 | 0 | 0.0 KB | 0 | 0 | 0 | 00:00:20 |
| 2 | *.man.lodz.pl | 2884 | 0 | 0.0 KB | 0 | 4 | 0 | 00:00:25 |
| 3 | *.stretchoid.com | 4 | 0 | 0.0 KB | 0 | 0 | 0 | 00:00:20 |
| 4 | *.res.spectrum.com | 8 | 0 | 0.0 KB | 0 | 0 | 0 | 00:08:29 |
| 5 | unresolved | 596 | 0 | 0.0 KB | 0 | 0 | 0 | 00:01:16 |
| TOTAL: 5 | 3494 | 0 | 0.0 KB | 0 | 4 | 0 | 00:10:52 | |
NNRP total resource statistics [Top 20]:
| System | User(ms) | System(ms) | Idle(ms) | Elapsed |
|---|---|---|---|---|
| syn-066-061-098-095.res.spectrum.com | 0.126 | 0.206 | 0.000 | 00:08:29 |
| 172.16.2.4 | 1.264 | 2.822 | 0.000 | 00:00:33 |
| nms1.man.lodz.pl | 5.980 | 13.138 | 0.000 | 00:00:25 |
| 206.168.34.86 | 0.066 | 0.010 | 0.000 | 00:00:25 |
| azpdws28galu.stretchoid.com | 0.010 | 0.018 | 0.000 | 00:00:20 |
| 139.162.225.221.socradar-curiosity-wide-scan-project.socradar.com | 0.002 | 0.012 | 0.000 | 00:00:20 |
| 147.185.132.87 | 0.006 | 0.006 | 0.000 | 00:00:06 |
| 80.111.142.213 | 0.020 | 0.038 | 0.000 | 00:00:06 |
| 198.235.24.232 | 0.004 | 0.010 | 0.000 | 00:00:05 |
| isvcs01.man.lodz.pl | 0.010 | 0.026 | 0.000 | 00:00:00 |
| 45.146.130.122 | 0.006 | 0.006 | 0.000 | 00:00:00 |
| 141.98.83.86 | 0.002 | 0.012 | 0.000 | 00:00:00 |
| 80.94.95.168 | 0.002 | 0.012 | 0.000 | 00:00:00 |
| TOTAL: 13 | 7.498 | 16.316 | 0.000 | 00:10:52 |
NNRP unrecognized commands (by host) [Top 20]:
| System | Conn |
|---|---|
| 80.94.95.168 | 2 |
| azpdws28galu.stretchoid.com | 2 |
| 206.168.34.86 | 2 |
| 141.98.83.86 | 2 |
| 45.146.130.122 | 2 |
| TOTAL: 5 | 10 |
NNRP unrecognized commands (by command) [Top 20]:
| Command | Count |
|---|---|
| #003 | 6 |
| EHLO www.censys.io | 2 |
| MGLNDD_212.191.2.21_119 | 2 |
| TOTAL: 3 | 10 |
NNRP client timeouts [Top 20]:
| System | Conn | Peer |
|---|---|---|
| 80.94.95.168 | 2 | 2 |
| 45.146.130.122 | 2 | 2 |
| 141.98.83.86 | 2 | 2 |
| TOTAL: 3 | 6 | 10 |