Unknown entries from news log file:
First 4 / 4 lines (100.0%)
Log entries by program:
| Program name | Lines | %Lines | Size | %Size |
|---|---|---|---|---|
| inn | 309690 | 86.1% | 34.0 MB | 87.9% |
| innd | 32822 | 9.1% | 3.0 MB | 7.9% |
| nnrpd | 15848 | 4.4% | 1.5 MB | 3.8% |
| innfeed | 1236 | 0.3% | 160.5 KB | 0.4% |
| controlchan | 24 | 0.0% | 5.1 KB | 0.0% |
| overchan | 2 | 0.0% | 0.1 KB | 0.0% |
| pgpverify | 2 | 0.0% | 0.2 KB | 0.0% |
| TOTAL: 7 | 359624 | 100.0% | 38.7 MB | 100.0% |
History cache:
| Reason | Count | %Count |
|---|---|---|
| Do not exist | 616652 | 99.7% |
| Negative hits | 1126 | 0.2% |
| Cache misses | 318 | 0.1% |
| Positive hits | 120 | 0.0% |
| TOTAL: 4 | 618216 | 100.0% |
INND timer:
| Code region | Time | Pct | Invoked | Min(ms) | Avg(ms) | Max(ms) |
|---|---|---|---|---|---|---|
| article cancel | 00:00:00.044 | 0.0% | 352 | 0.000 | 0.125 | 1.333 |
| article cleanup | 00:00:01.608 | 0.0% | 618136 | 0.001 | 0.003 | 0.006 |
| article logging | 00:00:07.506 | 0.0% | 618208 | 0.005 | 0.012 | 0.021 |
| article parse | 00:00:13.494 | 0.0% | 2497560 | 0.003 | 0.005 | 0.008 |
| article write | 00:00:24.520 | 0.0% | 617850 | 0.022 | 0.040 | 0.535 |
| artlog/artcncl | 00:00:00.000 | 0.0% | 32 | 0.000 | 0.000 | 0.000 |
| data move | 00:00:01.652 | 0.0% | 3699188 | 0.000 | 0.000 | 0.001 |
| hisgrep/artcncl | 00:00:00.006 | 0.0% | 384 | 0.000 | 0.016 | 0.250 |
| hishave/artcncl | 00:00:00.000 | 0.0% | 32 | 0.000 | 0.000 | 0.000 |
| history grep | 00:00:00.000 | 0.0% | 0 | 0.000 | 0.000 | 0.000 |
| history lookup | 00:00:02.158 | 0.0% | 619384 | 0.000 | 0.003 | 0.021 |
| history sync | 00:00:00.030 | 0.0% | 736 | 0.000 | 0.041 | 1.500 |
| history write | 00:00:34.770 | 0.0% | 617850 | 0.029 | 0.056 | 1.192 |
| idle | 47:52:54.238 | 99.7% | 2958326 | 8.775 | 58.267 | 136.626 |
| nntp read | 00:00:20.054 | 0.0% | 2414080 | 0.006 | 0.008 | 0.013 |
| overview write | 00:00:00.872 | 0.0% | 617850 | 0.000 | 0.001 | 0.004 |
| perl filter | 00:05:37.046 | 0.2% | 617850 | 0.413 | 0.546 | 0.735 |
| python filter | 00:00:00.132 | 0.0% | 617852 | 0.000 | 0.000 | 0.002 |
| site send | 00:00:08.286 | 0.0% | 1250168 | 0.004 | 0.007 | 0.010 |
| TOTAL: 48:01:38.314 | 48:00:26.416 | 100.0% | - | - | - | - |
INNfeed timer:
| Code region | Time | Pct | Invoked | Min(ms) | Avg(ms) | Max(ms) |
|---|---|---|---|---|---|---|
| article new | 00:00:00.020 | 0.0% | 14454 | 0.000 | 0.001 | 0.021 |
| article prepare | 00:00:00.000 | 0.0% | 504 | 0.000 | 0.000 | 0.000 |
| article read | 00:00:00.006 | 0.0% | 126 | 0.000 | 0.048 | 1.000 |
| backlog stats | 00:00:00.006 | 0.0% | 88856 | 0.000 | 0.000 | 0.007 |
| callbacks | 00:00:00.000 | 0.0% | 0 | 0.000 | 0.000 | 0.000 |
| data read | 00:00:00.260 | 0.0% | 41650 | 0.000 | 0.006 | 0.029 |
| data write | 00:00:00.960 | 0.0% | 27038 | 0.000 | 0.036 | 0.154 |
| idle | 47:58:46.028 | 100.0% | 88856 | 965.093 | 1943.887 | 8013.947 |
| status file | 00:00:00.124 | 0.0% | 320 | 0.000 | 0.388 | 8.000 |
| TOTAL: 47:58:48.276 | 47:58:47.404 | 100.0% | - | - | - | - |
nnrpd timer:
| Code region | Time | Pct | Invoked | Min(ms) | Avg(ms) | Max(ms) |
|---|---|---|---|---|---|---|
| idle | 01:23:10.822 | 98.7% | 48828 | 1.000 | 102.212 | 3553.000 |
| newnews | 00:00:00.000 | 0.0% | 0 | 0.000 | 0.000 | 0.000 |
| nntpwrite | 00:00:01.332 | 0.0% | 110018 | 0.000 | 0.012 | 0.333 |
| readart | 00:00:00.002 | 0.0% | 32 | 0.000 | 0.062 | 0.500 |
| TOTAL: 01:24:15.064 | 01:23:12.156 | 98.8% | - | - | - | - |
Control commands to INND:
| Command | Number |
|---|---|
| flush | 54 |
| flushlogs | 4 |
| go | 4 |
| logmode | 4 |
| lowmark | 2 |
| mode | 298 |
| name | 4 |
| pause | 4 |
| paused | 4 |
| reload | 4 |
| reserve | 4 |
| TOTAL: 11 | 386 |
Control Channel:
| Sender | newgroup | rmgroup | Other | Bad PGP | DoIt | OK |
|---|---|---|---|---|---|---|
| moderator@dana.de | 0 | 0 | 2 | 2 | 0 | 2 |
| TOTAL | 0 | 0 | 2 | 2 | 0 | 2 |
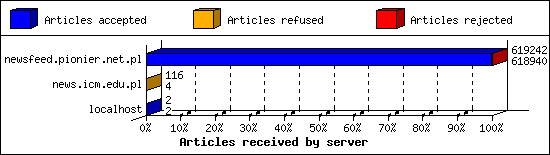
Incoming Feeds (INN):
| Server | Connects | Offered | Taken | Refused | Reject | %Accpt | Elapsed | |
|---|---|---|---|---|---|---|---|---|
| 1 | newsfeed.pionier.net.pl | 138 | 619242 | 618940 | 10 | 292 | 99% | 70:02:20 |
| 2 | news.icm.edu.pl | 60 | 116 | 4 | 112 | 0 | 3% | 13:39:00 |
| 3 | localhost | 4 | 2 | 2 | 0 | 0 | 100% | 00:00:00 |
| TOTAL: 3 | 202 | 619360 | 618946 | 122 | 292 | 99% | 83:41:20 | |
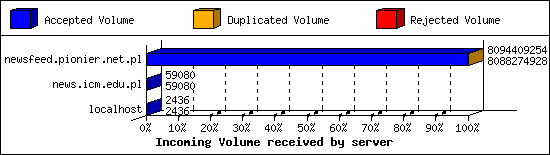
Incoming Volume (INN):
| Server | AcceptVol | DupVol | RejVol | TotalVol | %Acc | Vol/Art | |
|---|---|---|---|---|---|---|---|
| 1 | newsfeed.pionier.net.pl | 7.5 GB | 5.9 MB | 0.0 KB | 7.5 GB | 99% | 12.8 KB |
| 2 | news.icm.edu.pl | 57.7 KB | 0.0 KB | 0.0 KB | 57.7 KB | 100% | 14.4 KB |
| 3 | localhost | 2.4 KB | 0.0 KB | 0.0 KB | 2.4 KB | 100% | 1.2 KB |
| TOTAL: 3 | 7.5 GB | 5.9 MB | 0.0 KB | 7.5 GB | 99% | 12.8 KB | |
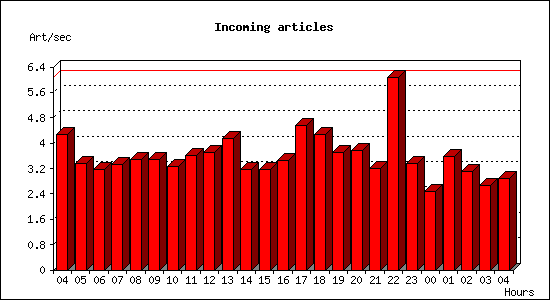
Incoming articles:
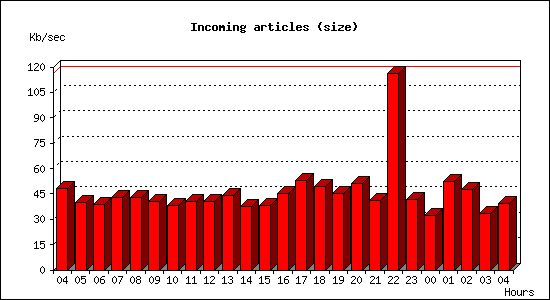
| Date | Articles | %Arts | Art/sec | Size | %Size | KB/sec |
|---|---|---|---|---|---|---|
| Aug 1 04:15:01 - 04:59:59 | 11572 | 3.7% | 4.29 | 126.8 MB | 3.3% | 48.09 |
| Aug 1 05:00:00 - 05:59:59 | 12055 | 3.9% | 3.35 | 140.9 MB | 3.7% | 40.08 |
| Aug 1 06:00:00 - 06:59:59 | 11354 | 3.7% | 3.15 | 135.2 MB | 3.5% | 38.46 |
| Aug 1 07:00:00 - 07:59:59 | 12009 | 3.9% | 3.34 | 150.2 MB | 3.9% | 42.72 |
| Aug 1 08:00:00 - 08:59:59 | 12552 | 4.1% | 3.49 | 150.8 MB | 3.9% | 42.89 |
| Aug 1 09:00:00 - 09:59:59 | 12549 | 4.1% | 3.49 | 142.1 MB | 3.7% | 40.41 |
| Aug 1 10:00:00 - 10:59:59 | 11738 | 3.8% | 3.26 | 134.2 MB | 3.5% | 38.17 |
| Aug 1 11:00:00 - 11:59:59 | 12942 | 4.2% | 3.60 | 141.7 MB | 3.7% | 40.30 |
| Aug 1 12:00:00 - 12:59:59 | 13322 | 4.3% | 3.70 | 141.4 MB | 3.7% | 40.21 |
| Aug 1 13:00:00 - 13:59:59 | 14884 | 4.8% | 4.13 | 154.2 MB | 4.0% | 43.87 |
| Aug 1 14:00:00 - 14:59:59 | 11415 | 3.7% | 3.17 | 132.1 MB | 3.4% | 37.57 |
| Aug 1 15:00:00 - 15:59:59 | 11430 | 3.7% | 3.17 | 134.3 MB | 3.5% | 38.21 |
| Aug 1 16:00:00 - 16:59:59 | 12457 | 4.0% | 3.46 | 158.9 MB | 4.1% | 45.21 |
| Aug 1 17:00:00 - 17:59:59 | 16354 | 5.3% | 4.54 | 185.9 MB | 4.8% | 52.88 |
| Aug 1 18:00:00 - 18:59:59 | 15353 | 5.0% | 4.26 | 174.3 MB | 4.5% | 49.57 |
| Aug 1 19:00:00 - 19:59:59 | 13303 | 4.3% | 3.70 | 159.9 MB | 4.1% | 45.48 |
| Aug 1 20:00:00 - 20:59:59 | 13581 | 4.4% | 3.77 | 179.6 MB | 4.7% | 51.09 |
| Aug 1 21:00:00 - 21:59:59 | 11498 | 3.7% | 3.19 | 144.5 MB | 3.7% | 41.09 |
| Aug 1 22:00:00 - 22:59:59 | 21878 | 7.1% | 6.08 | 407.7 MB | 10.6% | 115.98 |
| Aug 1 23:00:00 - 23:59:59 | 12060 | 3.9% | 3.35 | 147.0 MB | 3.8% | 41.80 |
| Aug 2 00:00:00 - 00:59:59 | 8945 | 2.9% | 2.48 | 112.4 MB | 2.9% | 31.98 |
| Aug 2 01:00:00 - 01:59:59 | 12891 | 4.2% | 3.58 | 183.9 MB | 4.8% | 52.32 |
| Aug 2 02:00:00 - 02:59:59 | 11186 | 3.6% | 3.11 | 167.4 MB | 4.3% | 47.63 |
| Aug 2 03:00:00 - 03:59:59 | 9557 | 3.1% | 2.65 | 117.9 MB | 3.1% | 33.52 |
| Aug 2 04:00:00 - 04:15:01 | 2607 | 0.8% | 2.89 | 34.8 MB | 0.9% | 39.60 |
| TOTAL: 24:00:00 | 309492 | 100.0% | 3.58 | 3.8 GB | 100.0% | 45.72 |
Sites sending bad articles:
| Server | Total | Group | Dist | Duplic | Unapp | TooOld | Site | Line | Other | |
|---|---|---|---|---|---|---|---|---|---|---|
| 1 | newsfeed.pionier.net.pl | 182 | 0 | 0 | 146 | 0 | 0 | 0 | 0 | 36 |
| TOTAL: 1 | 182 | 0 | 0 | 146 | 0 | 0 | 0 | 0 | 36 | |
Miscellaneous innd statistics [Top 10]:
| Event | Server | Number |
|---|---|---|
| Including strange strings | ||
| newsfeed.pionier.net.pl | 36 | |
| TOTAL: 1 | 36 | |
| TOTAL: 1 | 36 | |
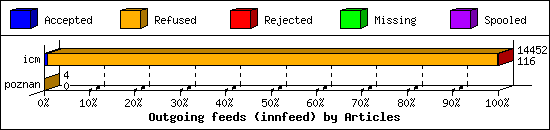
Outgoing Feeds (innfeed) by Articles:
| Server | Offered | Taken | Refused | Reject | Miss | Spool | %Took | Elapsed | |
|---|---|---|---|---|---|---|---|---|---|
| 1 | icm | 27234 | 116 | 14326 | 10 | 0 | 0 | 0% | 47:59:56 |
| 2 | poznan | 8 | 0 | 4 | 0 | 0 | 0 | 0% | 01:00:20 |
| TOTAL: 2 | 27242 | 116 | 14330 | 10 | 0 | 0 | 0% | 49:00:16 | |
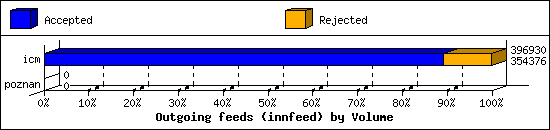
Outgoing Feeds (innfeed) by Volume:
| Server | AcceptVol | RejectVol | TotalVol | Volume/sec | Vol/Art | Elapsed | |
|---|---|---|---|---|---|---|---|
| 1 | icm | 346.1 KB | 41.6 KB | 387.6 KB | 0.0 KB/s | 3.1 KB | 47:59:56 |
| 2 | poznan | 0.0 KB | 0.0 KB | 0.0 KB | 0.0 KB/s | 0 | 01:00:20 |
| TOTAL: 2 | 346.1 KB | 41.6 KB | 387.6 KB | 0.0 KB/s | 3.1 KB | 49:00:16 | |
NNRP readership statistics:
| System | Conn | Arts | Size | Groups | Post | Rej | Elapsed | |
|---|---|---|---|---|---|---|---|---|
| 1 | 172.16.2.4 | 574 | 28 | 44.0 KB | 12 | 0 | 0 | 00:00:34 |
| 2 | syn-066-061-098-095.res.spectrum.com | 8 | 4 | 3.7 KB | 2 | 0 | 0 | 01:22:09 |
| 3 | isvcs01.man.lodz.pl | 2 | 0 | 0.0 KB | 0 | 2 | 0 | 00:00:00 |
| TOTAL: 3 | 584 | 32 | 47.7 KB | 14 | 2 | 0 | 01:24:16 | |
NNRP readership statistics (by domain):
| System | Conn | Arts | Size | Groups | Post | Rej | Elapsed | |
|---|---|---|---|---|---|---|---|---|
| 1 | unresolved | 612 | 28 | 44.0 KB | 12 | 0 | 0 | 00:01:42 |
| 2 | *.res.spectrum.com | 8 | 4 | 3.7 KB | 2 | 0 | 0 | 01:22:09 |
| 3 | *.man.lodz.pl | 2882 | 0 | 0.0 KB | 0 | 2 | 0 | 00:00:23 |
| 4 | *.stretchoid.com | 2 | 0 | 0.0 KB | 0 | 0 | 0 | 00:00:00 |
| 5 | *.211.203.35.bc.googleusercontent.com | 2 | 0 | 0.0 KB | 0 | 0 | 0 | 00:00:00 |
| TOTAL: 5 | 3506 | 32 | 47.7 KB | 14 | 2 | 0 | 01:24:16 | |
NNRP total resource statistics [Top 20]:
| System | User(ms) | System(ms) | Idle(ms) | Elapsed |
|---|---|---|---|---|
| syn-066-061-098-095.res.spectrum.com | 1.020 | 1.888 | 0.000 | 01:22:09 |
| 172.16.2.4 | 1.166 | 2.854 | 0.000 | 00:00:34 |
| 104.250.164.101 | 0.022 | 0.056 | 0.000 | 00:00:31 |
| nms1.man.lodz.pl | 5.972 | 13.074 | 0.000 | 00:00:23 |
| 167.94.138.194 | 0.070 | 0.034 | 0.000 | 00:00:14 |
| 206.168.34.73 | 0.080 | 0.018 | 0.000 | 00:00:10 |
| 80.111.142.213 | 0.022 | 0.036 | 0.000 | 00:00:05 |
| 198.235.24.56 | 0.006 | 0.006 | 0.000 | 00:00:02 |
| 198.235.24.154 | 0.000 | 0.012 | 0.000 | 00:00:01 |
| 104.152.52.148 | 0.006 | 0.008 | 0.000 | 00:00:00 |
| azpdcg4vpnu2.stretchoid.com | 0.006 | 0.008 | 0.000 | 00:00:00 |
| 102.211.203.35.bc.googleusercontent.com | 0.004 | 0.010 | 0.000 | 00:00:00 |
| isvcs01.man.lodz.pl | 0.008 | 0.016 | 0.000 | 00:00:00 |
| TOTAL: 13 | 8.382 | 18.020 | 0.000 | 01:24:16 |
Curious NNRP server explorers [Top 20]:
| System | Conn |
|---|---|
| nms1.man.lodz.pl | 2880 |
| 104.250.164.101 | 12 |
| 80.111.142.213 | 8 |
| 167.94.138.194 | 6 |
| 206.168.34.73 | 6 |
| 102.211.203.35.bc.googleusercontent.com | 2 |
| 104.152.52.148 | 2 |
| azpdcg4vpnu2.stretchoid.com | 2 |
| 198.235.24.56 | 2 |
| 198.235.24.154 | 2 |
| TOTAL: 10 | 2922 |
NNRP unrecognized commands (by host) [Top 20]:
| System | Conn |
|---|---|
| 102.211.203.35.bc.googleusercontent.com | 8 |
| 104.152.52.148 | 4 |
| 206.168.34.73 | 2 |
| azpdcg4vpnu2.stretchoid.com | 2 |
| 167.94.138.194 | 2 |
| TOTAL: 5 | 18 |
NNRP unrecognized commands (by command) [Top 20]:
| Command | Count |
|---|---|
| EHLO www.censys.io | 4 |
| Accept-Encoding: gzip | 2 |
| MGLNDD_212.191.2.21_119 | 2 |
| EHLO 212.191.2.21 | 2 |
| MAIL FROM:<relaycheck_please_ignore@prot... | 2 |
| GET / HTTP/1.1 | 2 |
| User-Agent: Hello from Palo Alto Network... | 2 |
| Host: 212.191.2.21:119 | 2 |
| TOTAL: 8 | 18 |
NNRP client timeouts [Top 20]:
| System | Conn | Peer |
|---|---|---|
| 206.168.34.73 | 2 | 4 |
| 167.94.138.194 | 2 | 4 |
| TOTAL: 2 | 4 | 20 |
Newsgroup request counts (by hierarchy):
| Hierarchy | Count | Pct | |
|---|---|---|---|
| 1 | pl | 28 | 87.5% |
| 2 | lodman | 4 | 12.5% |
| TOTAL: 2 | 32 | 100.0% | |
Newsgroup request counts (by newsgroup) [Top 100]:
| Newsgroup | Count | |
|---|---|---|
| 1 | pl.comp.os.ms-windows.winnt | 28 |
| 2 | lodman.test | 4 |
| TOTAL: 2 | 32 | |