Unknown entries from news log file:
First 2 / 2 lines (100.0%)
Log entries by program:
| Program name | Lines | %Lines | Size | %Size |
|---|---|---|---|---|
| inn | 201707 | 81.5% | 22.2 MB | 83.9% |
| innd | 28396 | 11.5% | 2.6 MB | 9.9% |
| nnrpd | 15984 | 6.5% | 1.5 MB | 5.6% |
| innfeed | 1250 | 0.5% | 159.3 KB | 0.6% |
| controlchan | 44 | 0.0% | 10.4 KB | 0.0% |
| overchan | 2 | 0.0% | 0.3 KB | 0.0% |
| pgpverify | 2 | 0.0% | 0.2 KB | 0.0% |
| TOTAL: 7 | 247385 | 100.0% | 26.4 MB | 100.0% |
History cache:
| Reason | Count | %Count |
|---|---|---|
| Do not exist | 400440 | 99.8% |
| Negative hits | 476 | 0.1% |
| Positive hits | 146 | 0.0% |
| Cache misses | 4 | 0.0% |
| TOTAL: 4 | 401066 | 100.0% |
INND timer:
| Code region | Time | Pct | Invoked | Min(ms) | Avg(ms) | Max(ms) |
|---|---|---|---|---|---|---|
| article cancel | 00:00:00.020 | 0.0% | 86 | 0.000 | 0.233 | 1.667 |
| article cleanup | 00:00:01.222 | 0.0% | 403916 | 0.000 | 0.003 | 0.008 |
| article logging | 00:00:05.480 | 0.0% | 404160 | 0.004 | 0.014 | 0.028 |
| article parse | 00:00:08.574 | 0.0% | 1474342 | 0.003 | 0.006 | 0.009 |
| article write | 00:00:15.308 | 0.0% | 403908 | 0.020 | 0.038 | 0.164 |
| artlog/artcncl | 00:00:00.000 | 0.0% | 12 | 0.000 | 0.000 | 0.000 |
| data move | 00:00:01.372 | 0.0% | 2212254 | 0.000 | 0.001 | 0.002 |
| hisgrep/artcncl | 00:00:00.000 | 0.0% | 98 | 0.000 | 0.000 | 0.000 |
| hishave/artcncl | 00:00:00.000 | 0.0% | 12 | 0.000 | 0.000 | 0.000 |
| history grep | 00:00:00.000 | 0.0% | 0 | 0.000 | 0.000 | 0.000 |
| history lookup | 00:00:01.432 | 0.0% | 404526 | 0.000 | 0.004 | 0.010 |
| history sync | 00:00:00.026 | 0.0% | 758 | 0.000 | 0.034 | 0.500 |
| history write | 00:00:26.914 | 0.0% | 403912 | 0.030 | 0.067 | 0.291 |
| idle | 47:55:43.852 | 99.8% | 1764188 | 35.769 | 97.804 | 215.677 |
| nntp read | 00:00:12.922 | 0.0% | 1413528 | 0.005 | 0.009 | 0.014 |
| overview write | 00:00:00.570 | 0.0% | 403908 | 0.000 | 0.001 | 0.006 |
| perl filter | 00:03:59.682 | 0.1% | 403912 | 0.374 | 0.593 | 0.763 |
| python filter | 00:00:00.110 | 0.0% | 403912 | 0.000 | 0.000 | 0.002 |
| site send | 00:00:06.048 | 0.0% | 822530 | 0.003 | 0.007 | 0.014 |
| TOTAL: 48:01:44.502 | 48:01:03.532 | 100.0% | - | - | - | - |
INNfeed timer:
| Code region | Time | Pct | Invoked | Min(ms) | Avg(ms) | Max(ms) |
|---|---|---|---|---|---|---|
| article new | 00:00:00.032 | 0.0% | 14708 | 0.000 | 0.002 | 0.043 |
| article prepare | 00:00:00.000 | 0.0% | 552 | 0.000 | 0.000 | 0.000 |
| article read | 00:00:00.000 | 0.0% | 138 | 0.000 | 0.000 | 0.000 |
| backlog stats | 00:00:00.026 | 0.0% | 86188 | 0.000 | 0.000 | 0.009 |
| callbacks | 00:00:00.000 | 0.0% | 0 | 0.000 | 0.000 | 0.000 |
| data read | 00:00:00.326 | 0.0% | 40920 | 0.000 | 0.008 | 0.062 |
| data write | 00:00:00.908 | 0.0% | 26164 | 0.000 | 0.035 | 0.104 |
| idle | 47:57:34.798 | 100.0% | 86188 | 626.369 | 2003.235 | 6685.811 |
| status file | 00:00:00.190 | 0.0% | 326 | 0.000 | 0.583 | 4.000 |
| TOTAL: 47:57:37.024 | 47:57:36.280 | 100.0% | - | - | - | - |
nnrpd timer:
| Code region | Time | Pct | Invoked | Min(ms) | Avg(ms) | Max(ms) |
|---|---|---|---|---|---|---|
| idle | 00:02:48.864 | 76.3% | 8898 | 1.000 | 18.978 | 10035.000 |
| newnews | 00:00:00.000 | 0.0% | 0 | 0.000 | 0.000 | 0.000 |
| nntpwrite | 00:00:00.296 | 0.1% | 30094 | 0.000 | 0.010 | 0.333 |
| TOTAL: 00:03:41.396 | 00:02:49.160 | 76.4% | - | - | - | - |
Control commands to INND:
| Command | Number |
|---|---|
| flush | 54 |
| flushlogs | 4 |
| go | 4 |
| logmode | 4 |
| lowmark | 2 |
| mode | 296 |
| name | 4 |
| pause | 4 |
| paused | 4 |
| reload | 4 |
| reserve | 4 |
| TOTAL: 11 | 384 |
Control Channel:
| Sender | newgroup | rmgroup | Other | Bad PGP | DoIt | OK |
|---|---|---|---|---|---|---|
| control@eternal-september.org | 0 | 0 | 2 | 0 | 0 | 2 |
| moderator@dana.de | 0 | 0 | 2 | 2 | 0 | 2 |
| TOTAL | 0 | 0 | 4 | 2 | 0 | 4 |
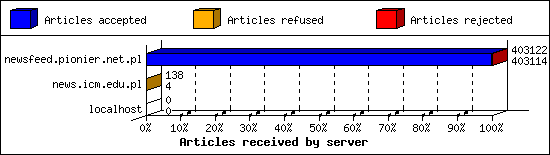
Incoming Feeds (INN):
| Server | Connects | Offered | Taken | Refused | Reject | %Accpt | Elapsed | |
|---|---|---|---|---|---|---|---|---|
| 1 | newsfeed.pionier.net.pl | 128 | 403122 | 403114 | 0 | 8 | 99% | 69:28:20 |
| 2 | news.icm.edu.pl | 64 | 138 | 4 | 134 | 0 | 2% | 13:17:38 |
| 3 | localhost | 2 | 0 | 0 | 0 | 0 | 0% | 00:00:00 |
| TOTAL: 3 | 194 | 403260 | 403118 | 134 | 8 | 99% | 82:45:58 | |
Incoming Volume (INN):
| Server | AcceptVol | DupVol | RejVol | TotalVol | %Acc | Vol/Art | |
|---|---|---|---|---|---|---|---|
| 1 | newsfeed.pionier.net.pl | 4.5 GB | 60.5 KB | 108.5 KB | 4.5 GB | 99% | 11.7 KB |
| 2 | news.icm.edu.pl | 60.4 KB | 0.0 KB | 0.0 KB | 60.4 KB | 100% | 15.1 KB |
| 3 | localhost | 0.0 KB | 0.0 KB | 0.0 KB | 0.0 KB | 0% | 0 |
| TOTAL: 3 | 4.5 GB | 60.5 KB | 108.5 KB | 4.5 GB | 99% | 11.7 KB | |

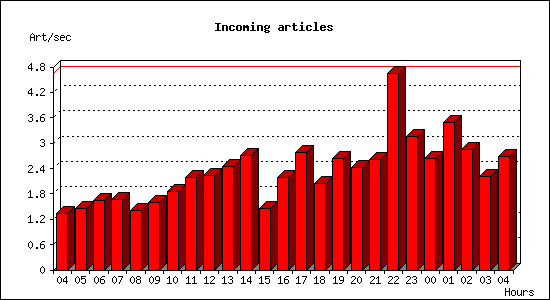
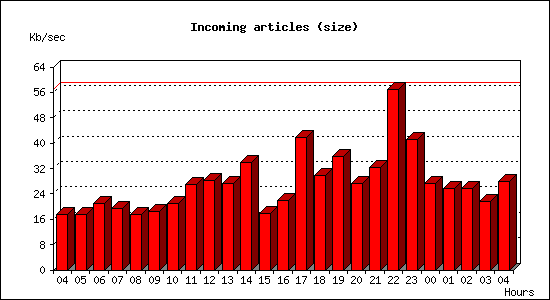
Incoming articles:
| Date | Articles | %Arts | Art/sec | Size | %Size | KB/sec |
|---|---|---|---|---|---|---|
| Sep 1 04:15:01 - 04:59:59 | 3575 | 1.8% | 1.32 | 46.1 MB | 2.0% | 17.48 |
| Sep 1 05:00:00 - 05:59:59 | 5260 | 2.6% | 1.46 | 62.1 MB | 2.7% | 17.65 |
| Sep 1 06:00:00 - 06:59:59 | 5888 | 2.9% | 1.64 | 73.6 MB | 3.2% | 20.95 |
| Sep 1 07:00:00 - 07:59:59 | 6029 | 3.0% | 1.67 | 67.7 MB | 2.9% | 19.24 |
| Sep 1 08:00:00 - 08:59:59 | 5038 | 2.5% | 1.40 | 61.9 MB | 2.7% | 17.59 |
| Sep 1 09:00:00 - 09:59:59 | 5760 | 2.9% | 1.60 | 64.4 MB | 2.8% | 18.31 |
| Sep 1 10:00:00 - 10:59:59 | 6688 | 3.3% | 1.86 | 74.1 MB | 3.2% | 21.08 |
| Sep 1 11:00:00 - 11:59:59 | 7894 | 3.9% | 2.19 | 94.9 MB | 4.1% | 27.01 |
| Sep 1 12:00:00 - 12:59:59 | 8038 | 4.0% | 2.23 | 99.2 MB | 4.3% | 28.22 |
| Sep 1 13:00:00 - 13:59:59 | 8843 | 4.4% | 2.46 | 95.6 MB | 4.1% | 27.19 |
| Sep 1 14:00:00 - 14:59:59 | 9756 | 4.8% | 2.71 | 118.8 MB | 5.2% | 33.79 |
| Sep 1 15:00:00 - 15:59:59 | 5208 | 2.6% | 1.45 | 62.2 MB | 2.7% | 17.68 |
| Sep 1 16:00:00 - 16:59:59 | 7886 | 3.9% | 2.19 | 76.6 MB | 3.3% | 21.78 |
| Sep 1 17:00:00 - 17:59:59 | 10006 | 5.0% | 2.78 | 147.1 MB | 6.4% | 41.85 |
| Sep 1 18:00:00 - 18:59:59 | 7402 | 3.7% | 2.06 | 105.2 MB | 4.6% | 29.92 |
| Sep 1 19:00:00 - 19:59:59 | 9496 | 4.7% | 2.64 | 126.3 MB | 5.5% | 35.93 |
| Sep 1 20:00:00 - 20:59:59 | 8697 | 4.3% | 2.42 | 95.5 MB | 4.1% | 27.17 |
| Sep 1 21:00:00 - 21:59:59 | 9396 | 4.7% | 2.61 | 113.7 MB | 4.9% | 32.34 |
| Sep 1 22:00:00 - 22:59:59 | 16707 | 8.3% | 4.64 | 200.2 MB | 8.7% | 56.95 |
| Sep 1 23:00:00 - 23:59:59 | 11368 | 5.6% | 3.16 | 144.3 MB | 6.3% | 41.05 |
| Sep 2 00:00:00 - 00:59:59 | 9458 | 4.7% | 2.63 | 95.9 MB | 4.2% | 27.27 |
| Sep 2 01:00:00 - 01:59:59 | 12584 | 6.2% | 3.50 | 90.1 MB | 3.9% | 25.62 |
| Sep 2 02:00:00 - 02:59:59 | 10243 | 5.1% | 2.85 | 89.9 MB | 3.9% | 25.57 |
| Sep 2 03:00:00 - 03:59:59 | 7925 | 3.9% | 2.20 | 76.2 MB | 3.3% | 21.67 |
| Sep 2 04:00:00 - 04:15:02 | 2430 | 1.2% | 2.69 | 24.7 MB | 1.1% | 28.02 |
| TOTAL: 24:00:01 | 201575 | 100.0% | 2.33 | 2.3 GB | 100.0% | 27.33 |
Sites sending bad articles:
| Server | Total | Group | Dist | Duplic | Unapp | TooOld | Site | Line | Other | |
|---|---|---|---|---|---|---|---|---|---|---|
| 1 | newsfeed.pionier.net.pl | 126 | 0 | 0 | 2 | 0 | 0 | 0 | 0 | 124 |
| TOTAL: 1 | 126 | 0 | 0 | 2 | 0 | 0 | 0 | 0 | 124 | |
INND Perl filter [Top 20]:
| Reason | Count |
|---|---|
| EMP (md5) | 4 |
| TOTAL: 1 | 4 |
Miscellaneous innd statistics [Top 10]:
| Event | Server | Number |
|---|---|---|
| Including strange strings | ||
| newsfeed.pionier.net.pl | 122 | |
| TOTAL: 1 | 122 | |
| TOTAL: 1 | 122 | |
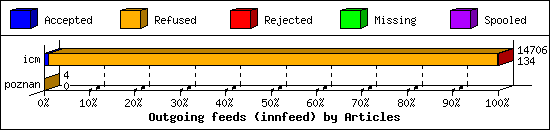
Outgoing Feeds (innfeed) by Articles:
| Server | Offered | Taken | Refused | Reject | Miss | Spool | %Took | Elapsed | |
|---|---|---|---|---|---|---|---|---|---|
| 1 | icm | 26800 | 134 | 14568 | 4 | 0 | 0 | 0% | 47:59:54 |
| 2 | poznan | 4 | 0 | 4 | 0 | 0 | 0 | 0% | 01:00:00 |
| TOTAL: 2 | 26804 | 134 | 14572 | 4 | 0 | 0 | 0% | 48:59:54 | |
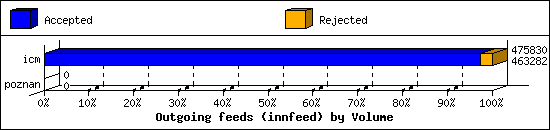
Outgoing Feeds (innfeed) by Volume:
| Server | AcceptVol | RejectVol | TotalVol | Volume/sec | Vol/Art | Elapsed | |
|---|---|---|---|---|---|---|---|
| 1 | icm | 452.4 KB | 12.3 KB | 464.7 KB | 0.0 KB/s | 3.4 KB | 47:59:54 |
| 2 | poznan | 0.0 KB | 0.0 KB | 0.0 KB | 0.0 KB/s | 0 | 01:00:00 |
| TOTAL: 2 | 452.4 KB | 12.3 KB | 464.7 KB | 0.0 KB/s | 3.4 KB | 48:59:54 | |
NNRP readership statistics:
| System | Conn | Arts | Size | Groups | Post | Rej | Elapsed | |
|---|---|---|---|---|---|---|---|---|
| 1 | 172.16.2.4 | 576 | 0 | 0.0 KB | 0 | 0 | 0 | 00:00:33 |
| 2 | azpdws4asgbk.stretchoid.com | 4 | 0 | 0.0 KB | 0 | 0 | 0 | 00:00:20 |
| 3 | 167.94.145.99 | 6 | 0 | 0.0 KB | 0 | 0 | 0 | 00:00:08 |
| 4 | 80.111.142.213 | 8 | 0 | 0.0 KB | 0 | 0 | 0 | 00:00:14 |
| 5 | 45.142.154.112 | 2 | 0 | 0.0 KB | 0 | 0 | 0 | 00:00:01 |
| 6 | 198.235.24.91 | 2 | 0 | 0.0 KB | 0 | 0 | 0 | 00:00:02 |
| 7 | battery.census.shodan.io | 2 | 0 | 0.0 KB | 0 | 0 | 0 | 00:00:00 |
| 8 | 172.202.113.251 | 4 | 0 | 0.0 KB | 0 | 0 | 0 | 00:00:20 |
| 9 | 194.180.48.168 | 2 | 0 | 0.0 KB | 0 | 0 | 0 | 00:00:00 |
| 10 | 205.210.31.155 | 2 | 0 | 0.0 KB | 0 | 0 | 0 | 00:00:07 |
| 11 | nms2.man.lodz.pl | 2880 | 0 | 0.0 KB | 0 | 0 | 0 | 00:00:23 |
| 12 | 206.168.34.120 | 2 | 0 | 0.0 KB | 0 | 0 | 0 | 00:00:18 |
| 13 | syn-066-061-098-095.res.spectrum.com | 52 | 0 | 0.0 KB | 0 | 0 | 0 | 00:01:10 |
| 14 | b4.scanner.modat.io | 2 | 0 | 0.0 KB | 0 | 0 | 0 | 00:00:00 |
| TOTAL: 14 | 3544 | 0 | 0.0 KB | 0 | 0 | 0 | 00:03:42 | |
NNRP readership statistics (by domain):
| System | Conn | Arts | Size | Groups | Post | Rej | Elapsed | |
|---|---|---|---|---|---|---|---|---|
| 1 | *.stretchoid.com | 4 | 0 | 0.0 KB | 0 | 0 | 0 | 00:00:20 |
| 2 | *.census.shodan.io | 2 | 0 | 0.0 KB | 0 | 0 | 0 | 00:00:00 |
| 3 | *.scanner.modat.io | 2 | 0 | 0.0 KB | 0 | 0 | 0 | 00:00:00 |
| 4 | *.res.spectrum.com | 52 | 0 | 0.0 KB | 0 | 0 | 0 | 00:01:10 |
| 5 | *.man.lodz.pl | 2880 | 0 | 0.0 KB | 0 | 0 | 0 | 00:00:23 |
| 6 | unresolved | 604 | 0 | 0.0 KB | 0 | 0 | 0 | 00:01:47 |
| TOTAL: 6 | 3544 | 0 | 0.0 KB | 0 | 0 | 0 | 00:03:42 | |
NNRP total resource statistics [Top 20]:
| System | User(ms) | System(ms) | Idle(ms) | Elapsed |
|---|---|---|---|---|
| syn-066-061-098-095.res.spectrum.com | 0.130 | 0.264 | 0.000 | 00:01:10 |
| 172.16.2.4 | 1.322 | 3.182 | 0.000 | 00:00:33 |
| nms2.man.lodz.pl | 6.268 | 15.126 | 0.000 | 00:00:23 |
| azpdws4asgbk.stretchoid.com | 0.006 | 0.022 | 0.000 | 00:00:20 |
| 172.202.113.251 | 0.008 | 0.022 | 0.000 | 00:00:20 |
| 206.168.34.120 | 0.096 | 0.016 | 0.000 | 00:00:18 |
| 80.111.142.213 | 0.018 | 0.050 | 0.000 | 00:00:14 |
| 167.94.145.99 | 0.072 | 0.034 | 0.000 | 00:00:08 |
| 205.210.31.155 | 0.004 | 0.012 | 0.000 | 00:00:07 |
| 198.235.24.91 | 0.006 | 0.008 | 0.000 | 00:00:02 |
| 45.142.154.112 | 0.002 | 0.014 | 0.000 | 00:00:01 |
| battery.census.shodan.io | 0.006 | 0.006 | 0.000 | 00:00:00 |
| 194.180.48.168 | 0.004 | 0.010 | 0.000 | 00:00:00 |
| b4.scanner.modat.io | 0.010 | 0.004 | 0.000 | 00:00:00 |
| TOTAL: 14 | 7.952 | 18.770 | 0.000 | 00:03:42 |
NNRP unrecognized commands (by host) [Top 20]:
| System | Conn |
|---|---|
| azpdws4asgbk.stretchoid.com | 2 |
| 167.94.145.99 | 2 |
| 206.168.34.120 | 2 |
| 194.180.48.168 | 2 |
| 172.202.113.251 | 2 |
| TOTAL: 5 | 10 |
NNRP unrecognized commands (by command) [Top 20]:
| Command | Count |
|---|---|
| MGLNDD_212.191.2.21_119 | 4 |
| EHLO www.censys.io | 4 |
| #003 | 2 |
| TOTAL: 3 | 10 |
NNRP client timeouts [Top 20]:
| System | Conn | Peer |
|---|---|---|
| 194.180.48.168 | 2 | 2 |
| 167.94.145.99 | 2 | 4 |
| TOTAL: 2 | 4 | 10 |