Unknown entries from news log file:
First 20 / 20 lines (100.0%)
Log entries by program:
| Program name | Lines | %Lines | Size | %Size |
|---|---|---|---|---|
| inn | 199940 | 82.0% | 22.1 MB | 84.3% |
| innd | 26664 | 10.9% | 2.5 MB | 9.5% |
| nnrpd | 15834 | 6.5% | 1.5 MB | 5.6% |
| innfeed | 1276 | 0.5% | 145.4 KB | 0.5% |
| overchan | 2 | 0.0% | 0.1 KB | 0.0% |
| controlchan | 2 | 0.0% | 0.1 KB | 0.0% |
| TOTAL: 6 | 243718 | 100.0% | 26.2 MB | 100.0% |
History cache:
| Reason | Count | %Count |
|---|---|---|
| Do not exist | 399506 | 99.8% |
| Negative hits | 800 | 0.2% |
| Positive hits | 142 | 0.0% |
| Cache misses | 6 | 0.0% |
| TOTAL: 4 | 400454 | 100.0% |
INND timer:
| Code region | Time | Pct | Invoked | Min(ms) | Avg(ms) | Max(ms) |
|---|---|---|---|---|---|---|
| article cancel | 00:00:00.012 | 0.0% | 272 | 0.000 | 0.044 | 1.000 |
| article cleanup | 00:00:01.184 | 0.0% | 399838 | 0.000 | 0.003 | 0.007 |
| article logging | 00:00:05.544 | 0.0% | 399952 | 0.006 | 0.014 | 0.026 |
| article parse | 00:00:08.172 | 0.0% | 1462482 | 0.003 | 0.006 | 0.011 |
| article write | 00:00:15.194 | 0.0% | 399828 | 0.022 | 0.038 | 0.069 |
| artlog/artcncl | 00:00:00.000 | 0.0% | 20 | 0.000 | 0.000 | 0.000 |
| data move | 00:00:01.144 | 0.0% | 2206502 | 0.000 | 0.001 | 0.002 |
| hisgrep/artcncl | 00:00:00.002 | 0.0% | 292 | 0.000 | 0.007 | 0.043 |
| hishave/artcncl | 00:00:00.000 | 0.0% | 20 | 0.000 | 0.000 | 0.000 |
| history grep | 00:00:00.000 | 0.0% | 0 | 0.000 | 0.000 | 0.000 |
| history lookup | 00:00:01.544 | 0.0% | 400852 | 0.000 | 0.004 | 0.012 |
| history sync | 00:00:00.028 | 0.0% | 748 | 0.000 | 0.037 | 0.667 |
| history write | 00:00:25.234 | 0.0% | 399832 | 0.030 | 0.063 | 0.206 |
| idle | 47:55:55.524 | 99.8% | 1782742 | 51.092 | 96.792 | 557.758 |
| nntp read | 00:00:13.122 | 0.0% | 1419678 | 0.006 | 0.009 | 0.016 |
| overview write | 00:00:00.598 | 0.0% | 399828 | 0.000 | 0.001 | 0.007 |
| perl filter | 00:03:41.040 | 0.1% | 399832 | 0.402 | 0.553 | 0.739 |
| python filter | 00:00:00.100 | 0.0% | 399852 | 0.000 | 0.000 | 0.003 |
| site send | 00:00:05.714 | 0.0% | 821608 | 0.003 | 0.007 | 0.013 |
| TOTAL: 48:01:32.168 | 48:00:54.156 | 100.0% | - | - | - | - |
INNfeed timer:
| Code region | Time | Pct | Invoked | Min(ms) | Avg(ms) | Max(ms) |
|---|---|---|---|---|---|---|
| article new | 00:00:00.036 | 0.0% | 21946 | 0.000 | 0.002 | 0.031 |
| article prepare | 00:00:00.000 | 0.0% | 1888 | 0.000 | 0.000 | 0.000 |
| article read | 00:00:00.012 | 0.0% | 472 | 0.000 | 0.025 | 1.000 |
| backlog stats | 00:00:00.014 | 0.0% | 119786 | 0.000 | 0.000 | 0.004 |
| callbacks | 00:00:00.000 | 0.0% | 0 | 0.000 | 0.000 | 0.000 |
| data read | 00:00:00.436 | 0.0% | 60404 | 0.000 | 0.007 | 0.031 |
| data write | 00:00:01.198 | 0.0% | 37704 | 0.000 | 0.032 | 0.083 |
| idle | 47:58:54.454 | 100.0% | 119786 | 489.216 | 1442.025 | 3752.338 |
| status file | 00:00:00.186 | 0.0% | 334 | 0.000 | 0.557 | 4.000 |
| TOTAL: 47:58:57.312 | 47:58:56.336 | 100.0% | - | - | - | - |
nnrpd timer:
| Code region | Time | Pct | Invoked | Min(ms) | Avg(ms) | Max(ms) |
|---|---|---|---|---|---|---|
| idle | 00:01:19.230 | 76.3% | 8872 | 1.000 | 8.930 | 10051.000 |
| newnews | 00:00:00.000 | 0.0% | 0 | 0.000 | 0.000 | 0.000 |
| nntpwrite | 00:00:00.312 | 0.3% | 29838 | 0.000 | 0.010 | 0.333 |
| TOTAL: 00:01:43.788 | 00:01:19.542 | 76.6% | - | - | - | - |
Control commands to INND:
| Command | Number |
|---|---|
| flush | 54 |
| flushlogs | 4 |
| go | 4 |
| logmode | 4 |
| lowmark | 2 |
| mode | 298 |
| name | 4 |
| pause | 4 |
| paused | 4 |
| reload | 4 |
| reserve | 4 |
| TOTAL: 11 | 386 |
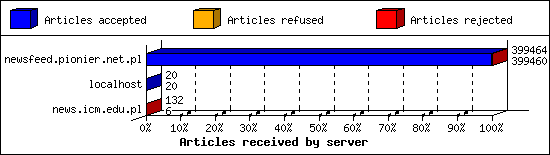
Incoming Feeds (INN):
| Server | Connects | Offered | Taken | Refused | Reject | %Accpt | Elapsed | |
|---|---|---|---|---|---|---|---|---|
| 1 | newsfeed.pionier.net.pl | 122 | 399464 | 399460 | 2 | 2 | 99% | 68:20:32 |
| 2 | localhost | 22 | 20 | 20 | 0 | 0 | 100% | 00:00:00 |
| 3 | news.icm.edu.pl | 58 | 132 | 6 | 118 | 8 | 4% | 12:18:24 |
| TOTAL: 3 | 202 | 399616 | 399486 | 120 | 10 | 99% | 80:38:56 | |
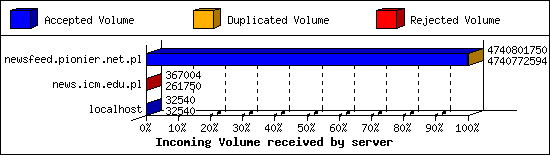
Incoming Volume (INN):
| Server | AcceptVol | DupVol | RejVol | TotalVol | %Acc | Vol/Art | |
|---|---|---|---|---|---|---|---|
| 1 | newsfeed.pionier.net.pl | 4.4 GB | 28.5 KB | 0.0 KB | 4.4 GB | 99% | 11.6 KB |
| 2 | news.icm.edu.pl | 255.6 KB | 56.6 KB | 46.2 KB | 358.4 KB | 71% | 25.6 KB |
| 3 | localhost | 31.8 KB | 0.0 KB | 0.0 KB | 31.8 KB | 100% | 1.6 KB |
| TOTAL: 3 | 4.4 GB | 85.1 KB | 46.2 KB | 4.4 GB | 99% | 11.6 KB | |
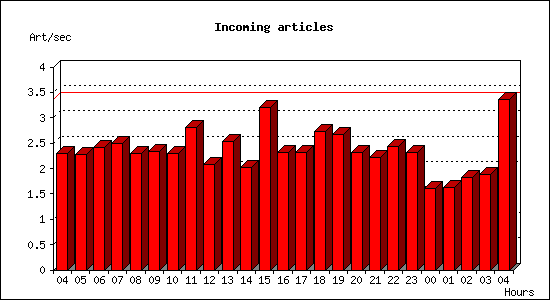
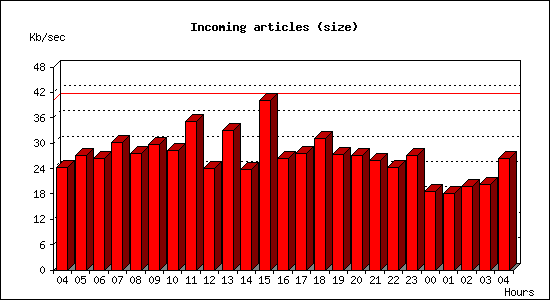
Incoming articles:
| Date | Articles | %Arts | Art/sec | Size | %Size | KB/sec |
|---|---|---|---|---|---|---|
| Sep 24 04:15:02 - 04:59:59 | 6181 | 3.1% | 2.29 | 63.6 MB | 2.8% | 24.14 |
| Sep 24 05:00:00 - 05:59:59 | 8216 | 4.1% | 2.28 | 94.9 MB | 4.2% | 27.00 |
| Sep 24 06:00:00 - 06:59:59 | 8678 | 4.3% | 2.41 | 93.0 MB | 4.1% | 26.44 |
| Sep 24 07:00:00 - 07:59:59 | 8963 | 4.5% | 2.49 | 106.0 MB | 4.7% | 30.14 |
| Sep 24 08:00:00 - 08:59:59 | 8250 | 4.1% | 2.29 | 97.1 MB | 4.3% | 27.61 |
| Sep 24 09:00:00 - 09:59:59 | 8380 | 4.2% | 2.33 | 104.6 MB | 4.6% | 29.75 |
| Sep 24 10:00:00 - 10:59:59 | 8260 | 4.1% | 2.29 | 99.5 MB | 4.4% | 28.31 |
| Sep 24 11:00:00 - 11:59:59 | 10086 | 5.0% | 2.80 | 123.7 MB | 5.5% | 35.18 |
| Sep 24 12:00:00 - 12:59:59 | 7453 | 3.7% | 2.07 | 84.7 MB | 3.7% | 24.10 |
| Sep 24 13:00:00 - 13:59:59 | 9103 | 4.6% | 2.53 | 116.1 MB | 5.1% | 33.01 |
| Sep 24 14:00:00 - 14:59:59 | 7292 | 3.6% | 2.03 | 83.9 MB | 3.7% | 23.86 |
| Sep 24 15:00:00 - 15:59:59 | 11525 | 5.8% | 3.20 | 141.0 MB | 6.2% | 40.11 |
| Sep 24 16:00:00 - 16:59:59 | 8334 | 4.2% | 2.31 | 92.5 MB | 4.1% | 26.31 |
| Sep 24 17:00:00 - 17:59:59 | 8320 | 4.2% | 2.31 | 96.5 MB | 4.3% | 27.43 |
| Sep 24 18:00:00 - 18:59:59 | 9836 | 4.9% | 2.73 | 109.6 MB | 4.8% | 31.17 |
| Sep 24 19:00:00 - 19:59:59 | 9594 | 4.8% | 2.67 | 96.1 MB | 4.2% | 27.35 |
| Sep 24 20:00:00 - 20:59:59 | 8351 | 4.2% | 2.32 | 95.0 MB | 4.2% | 27.01 |
| Sep 24 21:00:00 - 21:59:59 | 7968 | 4.0% | 2.21 | 91.3 MB | 4.0% | 25.97 |
| Sep 24 22:00:00 - 22:59:59 | 8744 | 4.4% | 2.43 | 85.5 MB | 3.8% | 24.32 |
| Sep 24 23:00:00 - 23:59:59 | 8319 | 4.2% | 2.31 | 95.5 MB | 4.2% | 27.18 |
| Sep 25 00:00:00 - 00:59:59 | 5810 | 2.9% | 1.61 | 65.4 MB | 2.9% | 18.60 |
| Sep 25 01:00:00 - 01:59:59 | 5877 | 2.9% | 1.63 | 63.3 MB | 2.8% | 18.01 |
| Sep 25 02:00:00 - 02:59:59 | 6542 | 3.3% | 1.82 | 69.7 MB | 3.1% | 19.82 |
| Sep 25 03:00:00 - 03:59:59 | 6754 | 3.4% | 1.88 | 70.8 MB | 3.1% | 20.15 |
| Sep 25 04:00:00 - 04:15:01 | 3032 | 1.5% | 3.37 | 23.1 MB | 1.0% | 26.31 |
| TOTAL: 23:59:59 | 199868 | 100.0% | 2.31 | 2.2 GB | 100.0% | 26.81 |
Sites sending bad articles:
| Server | Total | Group | Dist | Duplic | Unapp | TooOld | Site | Line | Other | |
|---|---|---|---|---|---|---|---|---|---|---|
| 1 | newsfeed.pionier.net.pl | 58 | 0 | 0 | 1 | 0 | 0 | 0 | 0 | 57 |
| 2 | news.icm.edu.pl | 4 | 0 | 0 | 2 | 0 | 0 | 0 | 0 | 2 |
| TOTAL: 2 | 62 | 0 | 0 | 3 | 0 | 0 | 0 | 0 | 59 | |
INND Perl filter [Top 20]:
| Reason | Count |
|---|---|
| Binary in non-binary group | 4 |
| TOTAL: 1 | 4 |
Miscellaneous innd statistics [Top 10]:
| Event | Server | Number |
|---|---|---|
| Including strange strings | ||
| newsfeed.pionier.net.pl | 57 | |
| TOTAL: 1 | 57 | |
| TOTAL: 1 | 57 | |
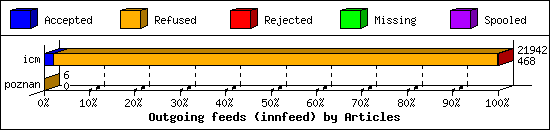
Outgoing Feeds (innfeed) by Articles:
| Server | Offered | Taken | Refused | Reject | Miss | Spool | %Took | Elapsed | |
|---|---|---|---|---|---|---|---|---|---|
| 1 | icm | 40240 | 468 | 21470 | 4 | 0 | 0 | 1% | 47:59:46 |
| 2 | poznan | 6 | 0 | 6 | 0 | 0 | 0 | 0% | 01:20:00 |
| TOTAL: 2 | 40246 | 468 | 21476 | 4 | 0 | 0 | 1% | 49:19:46 | |
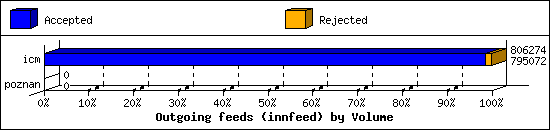
Outgoing Feeds (innfeed) by Volume:
| Server | AcceptVol | RejectVol | TotalVol | Volume/sec | Vol/Art | Elapsed | |
|---|---|---|---|---|---|---|---|
| 1 | icm | 776.4 KB | 10.9 KB | 787.4 KB | 0.0 KB/s | 1.7 KB | 47:59:46 |
| 2 | poznan | 0.0 KB | 0.0 KB | 0.0 KB | 0.0 KB/s | 0 | 01:20:00 |
| TOTAL: 2 | 776.4 KB | 10.9 KB | 787.4 KB | 0.0 KB/s | 1.7 KB | 49:19:46 | |
NNRP readership statistics:
| System | Conn | Arts | Size | Groups | Post | Rej | Elapsed | |
|---|---|---|---|---|---|---|---|---|
| 1 | 167.94.146.63 | 6 | 0 | 0.0 KB | 0 | 0 | 0 | 00:00:06 |
| 2 | nms2.man.lodz.pl | 2064 | 0 | 0.0 KB | 0 | 0 | 0 | 00:00:15 |
| 3 | pleasant.monitoring.internet-measurement.com | 2 | 0 | 0.0 KB | 0 | 0 | 0 | 00:00:03 |
| 4 | nms1.man.lodz.pl | 814 | 0 | 0.0 KB | 0 | 0 | 0 | 00:00:06 |
| 5 | 198.235.24.33 | 2 | 0 | 0.0 KB | 0 | 0 | 0 | 00:00:07 |
| 6 | isvcs01.man.lodz.pl | 20 | 0 | 0.0 KB | 0 | 20 | 0 | 00:00:01 |
| 7 | ns31410048.ip-145-239-154.eu | 4 | 0 | 0.0 KB | 0 | 0 | 0 | 00:00:00 |
| 8 | 147.185.132.109 | 2 | 0 | 0.0 KB | 0 | 0 | 0 | 00:00:00 |
| 9 | azpdsga05mgt.stretchoid.com | 4 | 0 | 0.0 KB | 0 | 0 | 0 | 00:00:20 |
| 10 | 172.16.2.4 | 576 | 0 | 0.0 KB | 0 | 0 | 0 | 00:00:32 |
| 11 | 147.185.132.255 | 2 | 0 | 0.0 KB | 0 | 0 | 0 | 00:00:03 |
| 12 | 80.111.142.213 | 8 | 0 | 0.0 KB | 0 | 0 | 0 | 00:00:05 |
| TOTAL: 12 | 3504 | 0 | 0.0 KB | 0 | 20 | 0 | 00:01:45 | |
NNRP readership statistics (by domain):
| System | Conn | Arts | Size | Groups | Post | Rej | Elapsed | |
|---|---|---|---|---|---|---|---|---|
| 1 | *.man.lodz.pl | 2898 | 0 | 0.0 KB | 0 | 20 | 0 | 00:00:23 |
| 2 | *.monitoring.internet-measurement.com | 2 | 0 | 0.0 KB | 0 | 0 | 0 | 00:00:03 |
| 3 | *.ip-145-239-154.eu | 4 | 0 | 0.0 KB | 0 | 0 | 0 | 00:00:00 |
| 4 | unresolved | 596 | 0 | 0.0 KB | 0 | 0 | 0 | 00:00:56 |
| 5 | *.stretchoid.com | 4 | 0 | 0.0 KB | 0 | 0 | 0 | 00:00:20 |
| TOTAL: 5 | 3504 | 0 | 0.0 KB | 0 | 20 | 0 | 00:01:45 | |
NNRP total resource statistics [Top 20]:
| System | User(ms) | System(ms) | Idle(ms) | Elapsed |
|---|---|---|---|---|
| 172.16.2.4 | 1.312 | 2.642 | 0.000 | 00:00:32 |
| azpdsga05mgt.stretchoid.com | 0.008 | 0.018 | 0.000 | 00:00:20 |
| nms2.man.lodz.pl | 4.262 | 9.014 | 0.000 | 00:00:15 |
| 198.235.24.33 | 0.002 | 0.010 | 0.000 | 00:00:07 |
| 167.94.146.63 | 0.078 | 0.024 | 0.000 | 00:00:06 |
| nms1.man.lodz.pl | 1.666 | 3.528 | 0.000 | 00:00:06 |
| 80.111.142.213 | 0.014 | 0.044 | 0.000 | 00:00:05 |
| pleasant.monitoring.internet-measurement.com | 0.008 | 0.008 | 0.000 | 00:00:03 |
| 147.185.132.255 | 0.004 | 0.010 | 0.000 | 00:00:03 |
| isvcs01.man.lodz.pl | 0.070 | 0.096 | 0.000 | 00:00:01 |
| ns31410048.ip-145-239-154.eu | 0.066 | 0.024 | 0.000 | 00:00:00 |
| 147.185.132.109 | 0.004 | 0.010 | 0.000 | 00:00:00 |
| TOTAL: 12 | 7.494 | 15.428 | 0.000 | 00:01:45 |
NNRP unrecognized commands (by host) [Top 20]:
| System | Conn |
|---|---|
| azpdsga05mgt.stretchoid.com | 2 |
| 167.94.146.63 | 2 |
| ns31410048.ip-145-239-154.eu | 2 |
| TOTAL: 3 | 6 |
NNRP unrecognized commands (by command) [Top 20]:
| Command | Count |
|---|---|
| MGLNDD_212.191.2.21_119 | 2 |
| #026#003 | 2 |
| EHLO www.censys.io | 2 |
| TOTAL: 3 | 6 |
NNRP client timeouts [Top 20]:
| System | Conn | Peer |
|---|---|---|
| ns31410048.ip-145-239-154.eu | 4 | 4 |
| 167.94.146.63 | 2 | 4 |
| TOTAL: 2 | 6 | 14 |